
Rugby Kicker and Fly-Half Prop Markets: Pricing the Boot
 Available in US
The position that scores 60 percent of the points
An honest observation from years of building rugby models: the goal-kicker accounts for somewhere between 40 and 60 percent of total points scored in a typical Six Nations match. Penalties, conversions, the occasional drop goal — the boot does most of the heavy lifting. And yet kicker prop markets are one of the more neglected corners of the rugby betting board. Most casual bettors stick to try scorer; serious bettors who add kicker props to their portfolio find a less crowded market with cleaner price discovery.
The position bias works in the kicker’s favour. Backs scored 66 percent of Six Nations 2023 tries, and the fly-half — the position that takes most goal kicks — is also one of the higher-frequency try-scoring backs. The combined points-by-player profile for a fly-half who kicks and scores can comfortably exceed any single try-scorer’s contribution to the scoreboard.
Core kicker markets
The standard menu of kicker prop markets across UK rugby sportsbooks. Points by named player (over/under specific totals). Successful conversions by named kicker (over/under). Successful penalties by named kicker (over/under). First successful penalty taker. Drop goal at any point in the match. Drop goal taker.
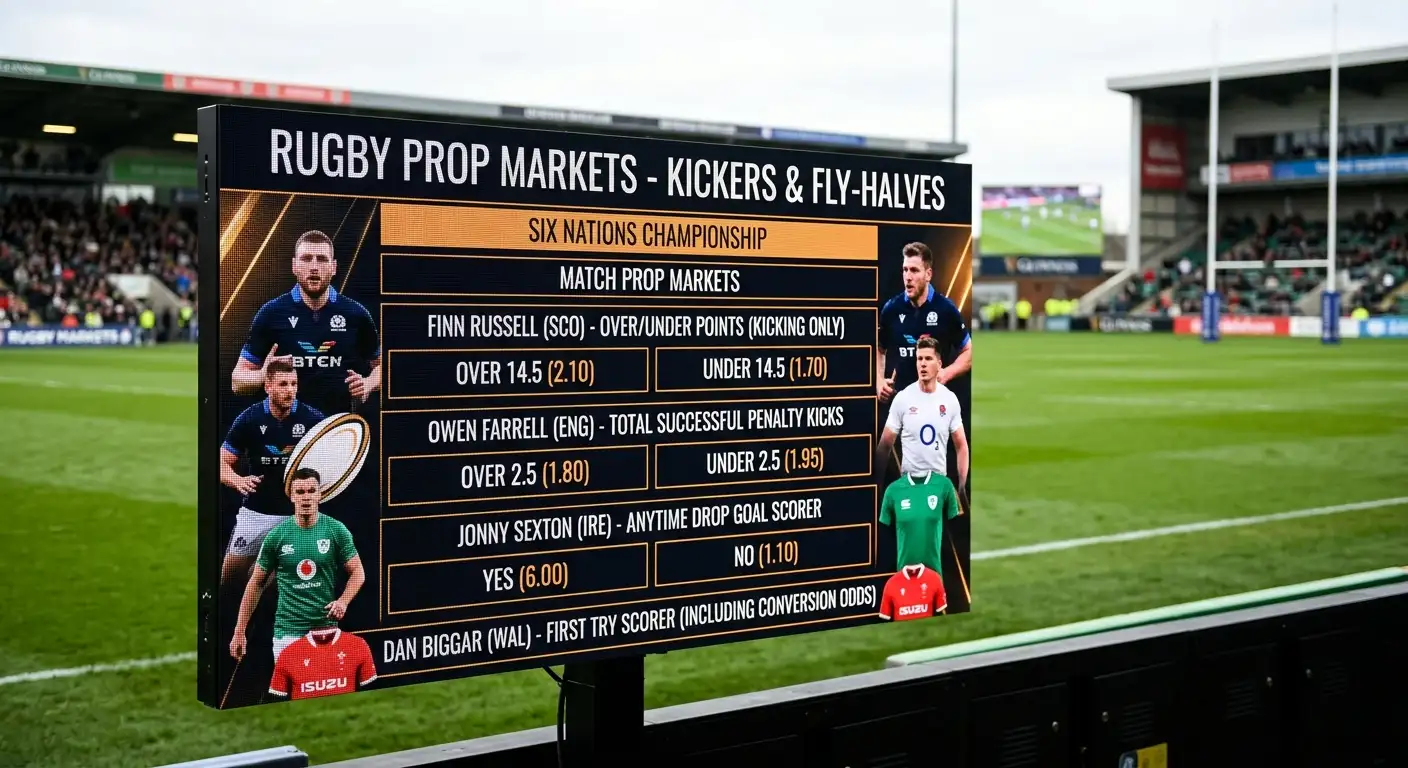
Points by player is the most active market. A named kicker on a side projected to win comfortably might have a points-by-player line set at 11.5 or 14.5. The over-under decision rests on the projected number of tries the kicker’s team scores (each try with conversion adds 7 to their team total, of which the kicker contributes 2), plus penalties attempted and converted, plus any drop goals.
The pricing on points by player tends to anchor on the kicker’s recent rolling average. A fly-half averaging 12 points per match across the past six matches will see lines set around 11.5 to 12.5. The over-under decision then turns on whether the specific match conditions favour higher or lower scoring than the rolling average.
Points by player versus team totals
Points by player and team totals correlate strongly. If you think a team will score 30 points, you have an implicit view on their kicker’s points contribution. If the kicker is the team’s primary goal kicker, expect roughly 50-70 percent of the team total in kicker points. If the team scores via running tries and the kicker has less involvement in scoring plays, the proportion drops.
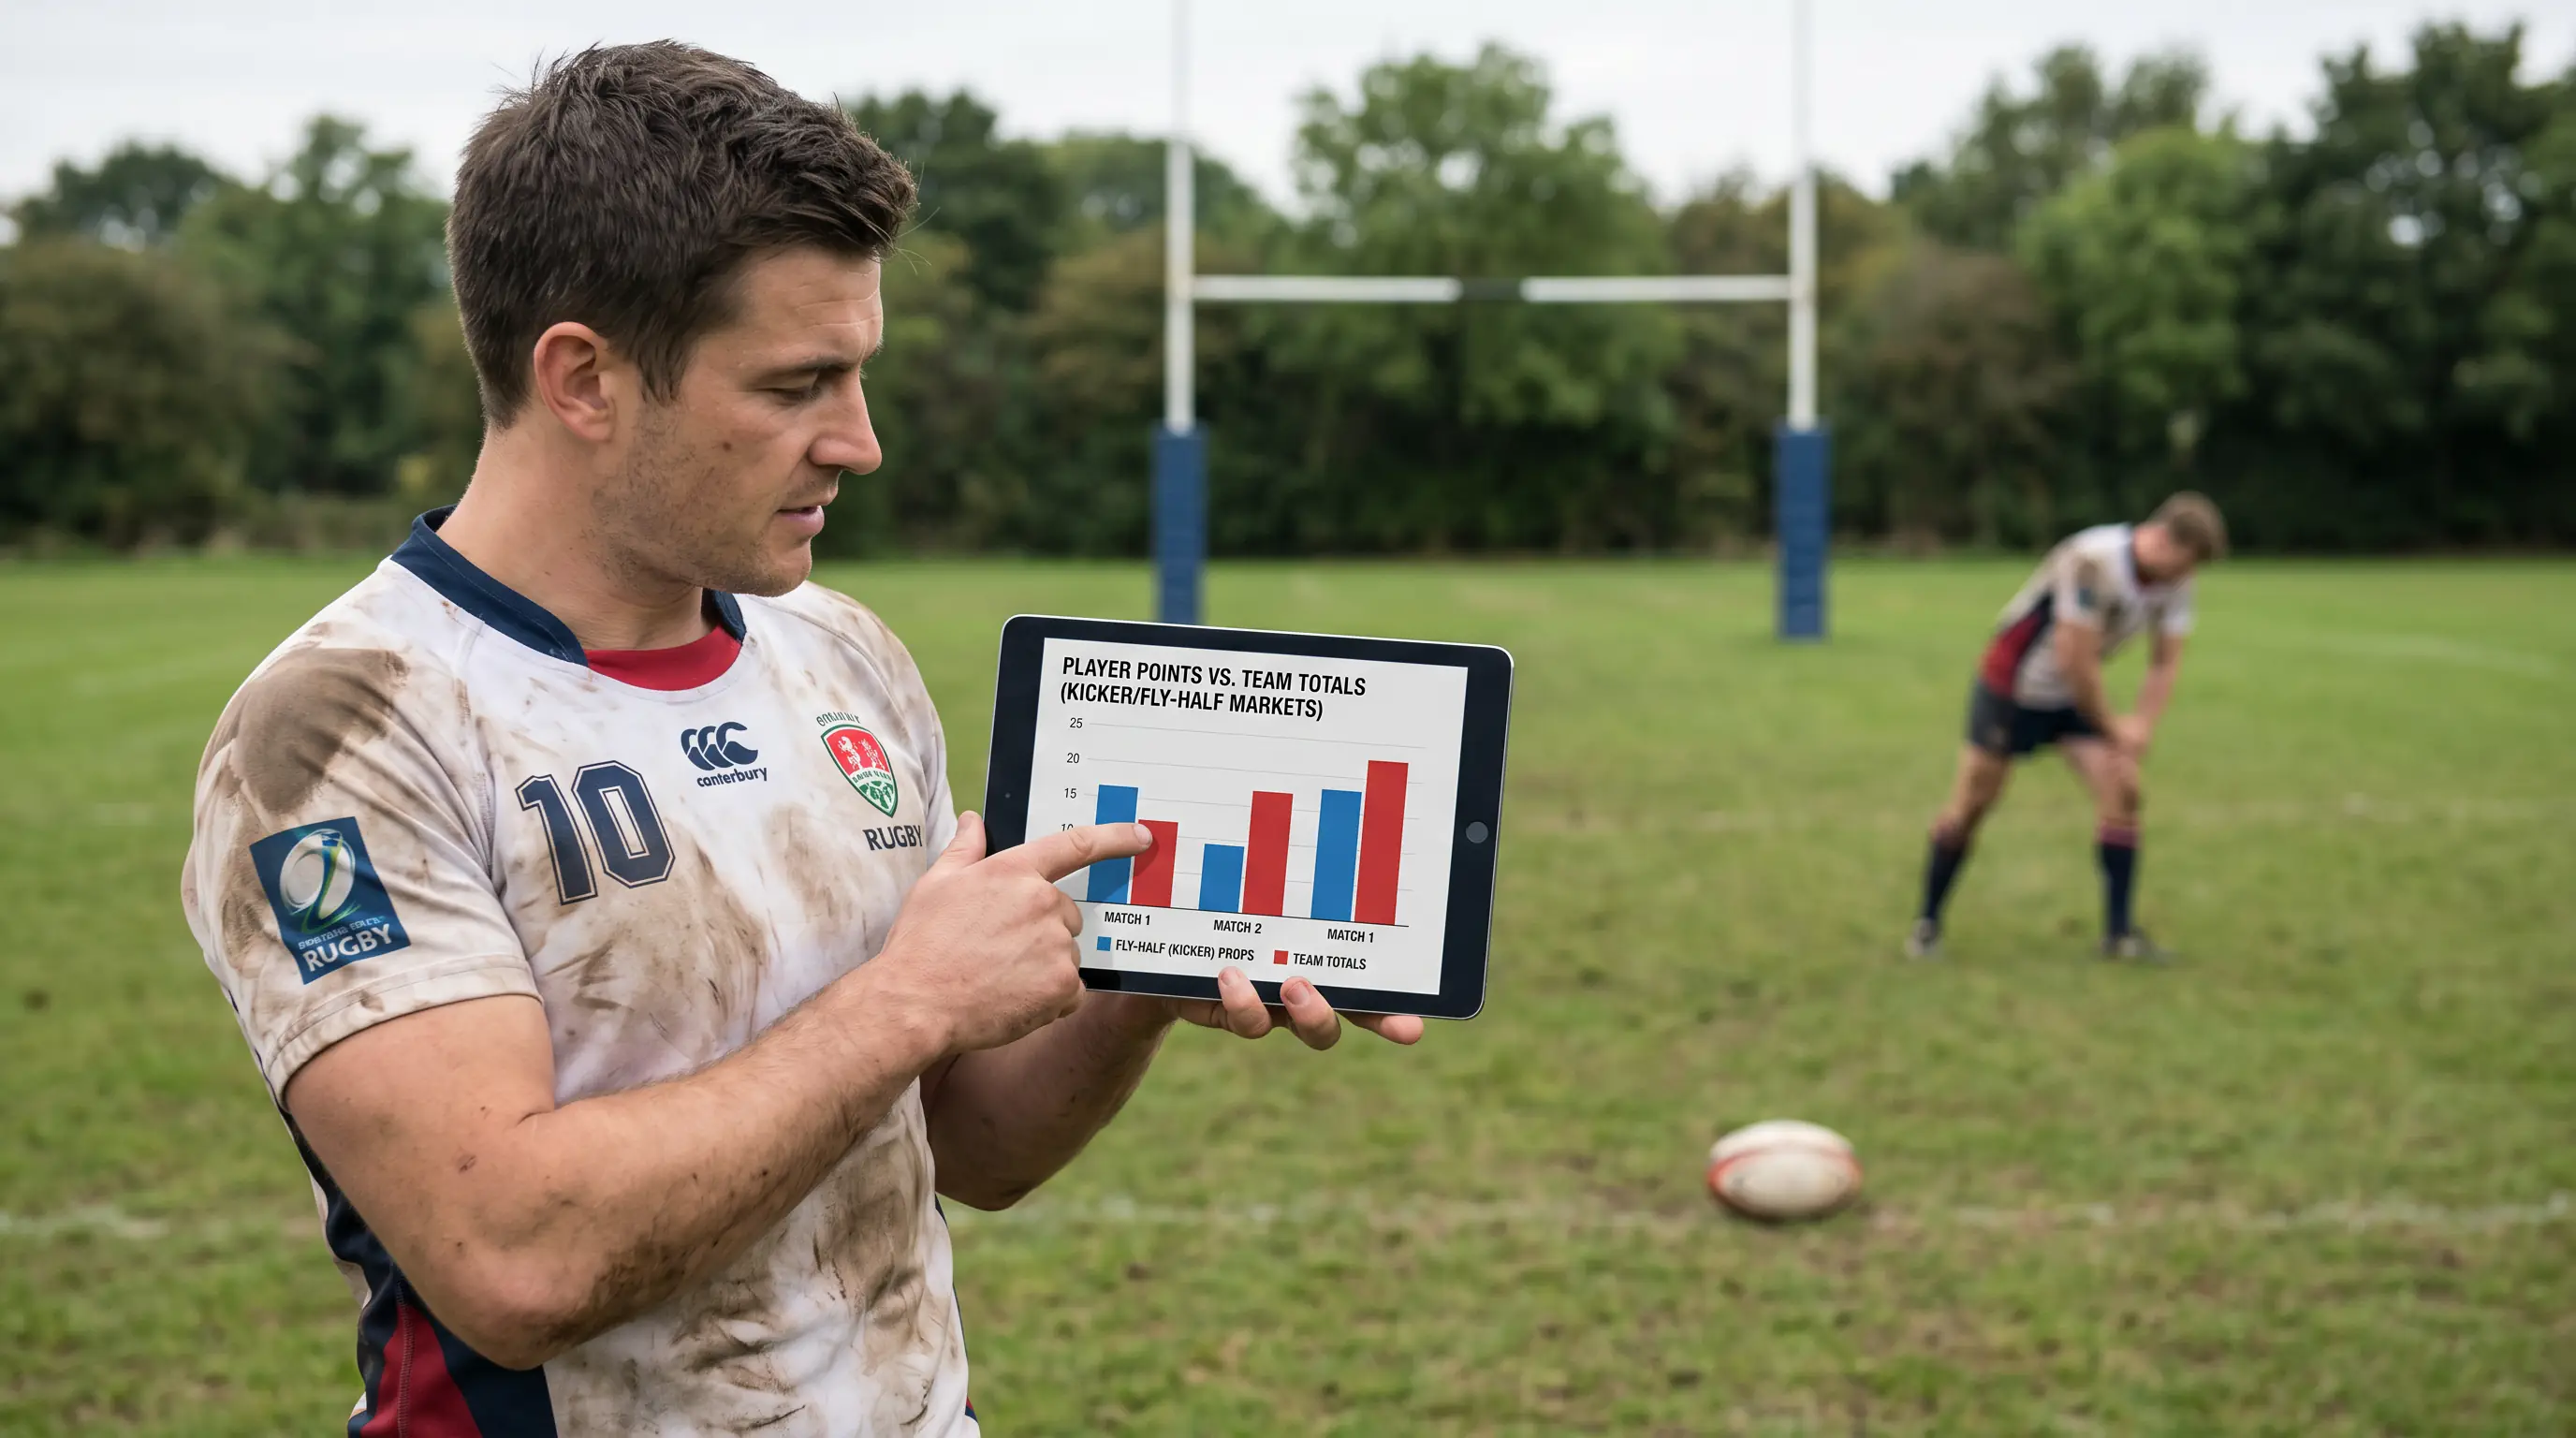
Bet builders that combine team totals with points by player create correlated-leg products that operators do not always price cleanly. A “team over 25.5 points” combined with “kicker over 15.5 points” is a heavily correlated combo — both legs win in the same scenario (a high-scoring match for the named team). Operators using simple multiplication offer better value than operators modelling the correlation.
The trap is the reverse case. “Team A wins” combined with “Player Y from Team A over 10.5 kicker points” — if Team A wins via tries from forwards with limited goal-kicking involvement, both legs can win independently. The correlation is positive but less strong than the obvious case, and the operator’s pricing may or may not reflect it.
Weather and conversion rate
Goal-kicking accuracy is the variable most affected by weather. Sustained wind above 20 mph reduces conversion percentages materially — sometimes by 15 to 20 percentage points compared with calm conditions. Heavy rain affects ball handling more than kicking specifically, but slippery balls compound the wind effect on accuracy.

Points by player lines move with weather but not always proportionally. A pre-match line based on a calm-conditions forecast may not adjust enough when the forecast firms toward windy conditions. The result is a windy-day under value that occasionally appears on points-by-player lines for top kickers. The opposite case — clear day, dome venue, no weather constraints — supports the over more often than the line implies, especially for kickers who under-perform their potential in normal conditions due to inconsistent kicking form.
Specific UK venues amplify the weather effect. Murrayfield in late winter sees significantly lower conversion rates than Twickenham on the same forecast — the open-bowl design catches wind from multiple directions and disrupts the kicker’s line. Indoor or covered venues (Principality Stadium with roof closed) eliminate weather as a variable and support higher kicker totals across the season.
Drop goal specials
Drop goal markets are the most exotic kicker props. “Drop goal at any time in the match” and “named player to score drop goal” are the standard offerings, with prices that vary widely across operators.
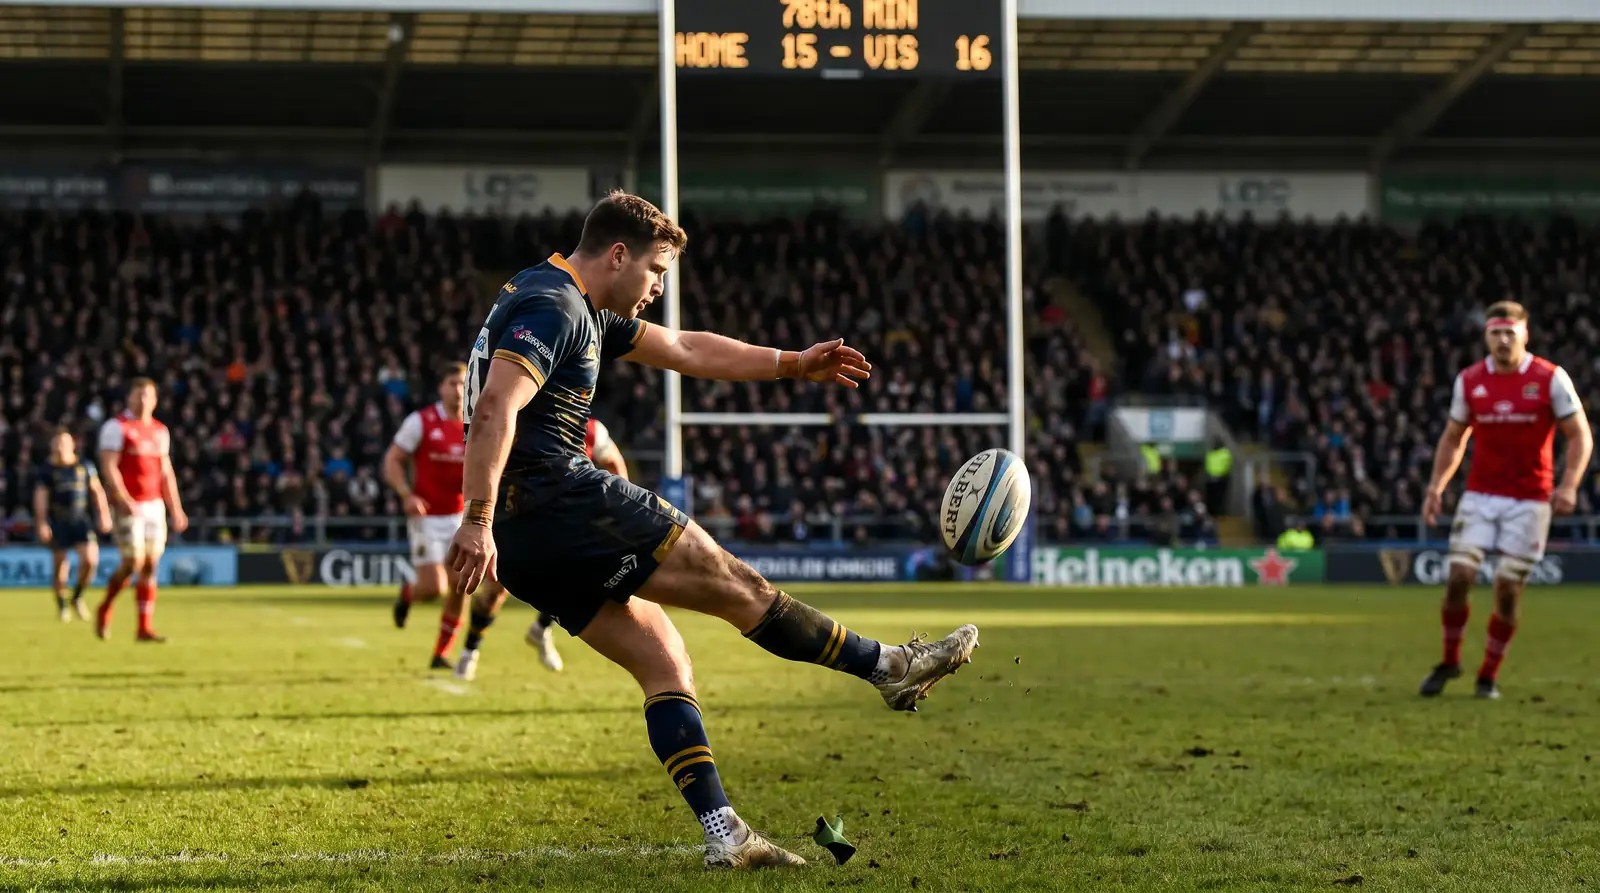
The honest baseline: drop goals are rare. In typical Six Nations matches, drop goals appear perhaps once every three to five matches. The pre-match price on “drop goal in the match” reflects this — typically 4.00 to 6.00 decimal, depending on the matchup. Specific player drop-goal markets (named player to drop a goal) price at 8.00 to 25.00 depending on the player.
Value in drop-goal specials sits in specific scenarios. Tight matches in the closing 10 minutes where one team has territory but cannot convert tries — these are the scenarios that produce most drop goals. Pre-match drop-goal pricing cannot anticipate this match script; live drop-goal markets in the 70th minute of a tight match can be excellent value if you read the territorial pattern correctly.
The other clean scenario: a known drop-goal specialist in the opposing 10. Some fly-halves are statistically more likely to attempt and convert drop goals than others. The named-player drop-goal markets sometimes mis-price this player-specific tendency, especially when the player has not attempted a drop goal in recent televised matches.
Tournament top points scorer
The tournament-long top points scorer market is the ante-post version of the kicker prop space. For the Six Nations, top points scorer typically runs across the entire tournament — combined points from tries, conversions, penalties, and drop goals across five matches.
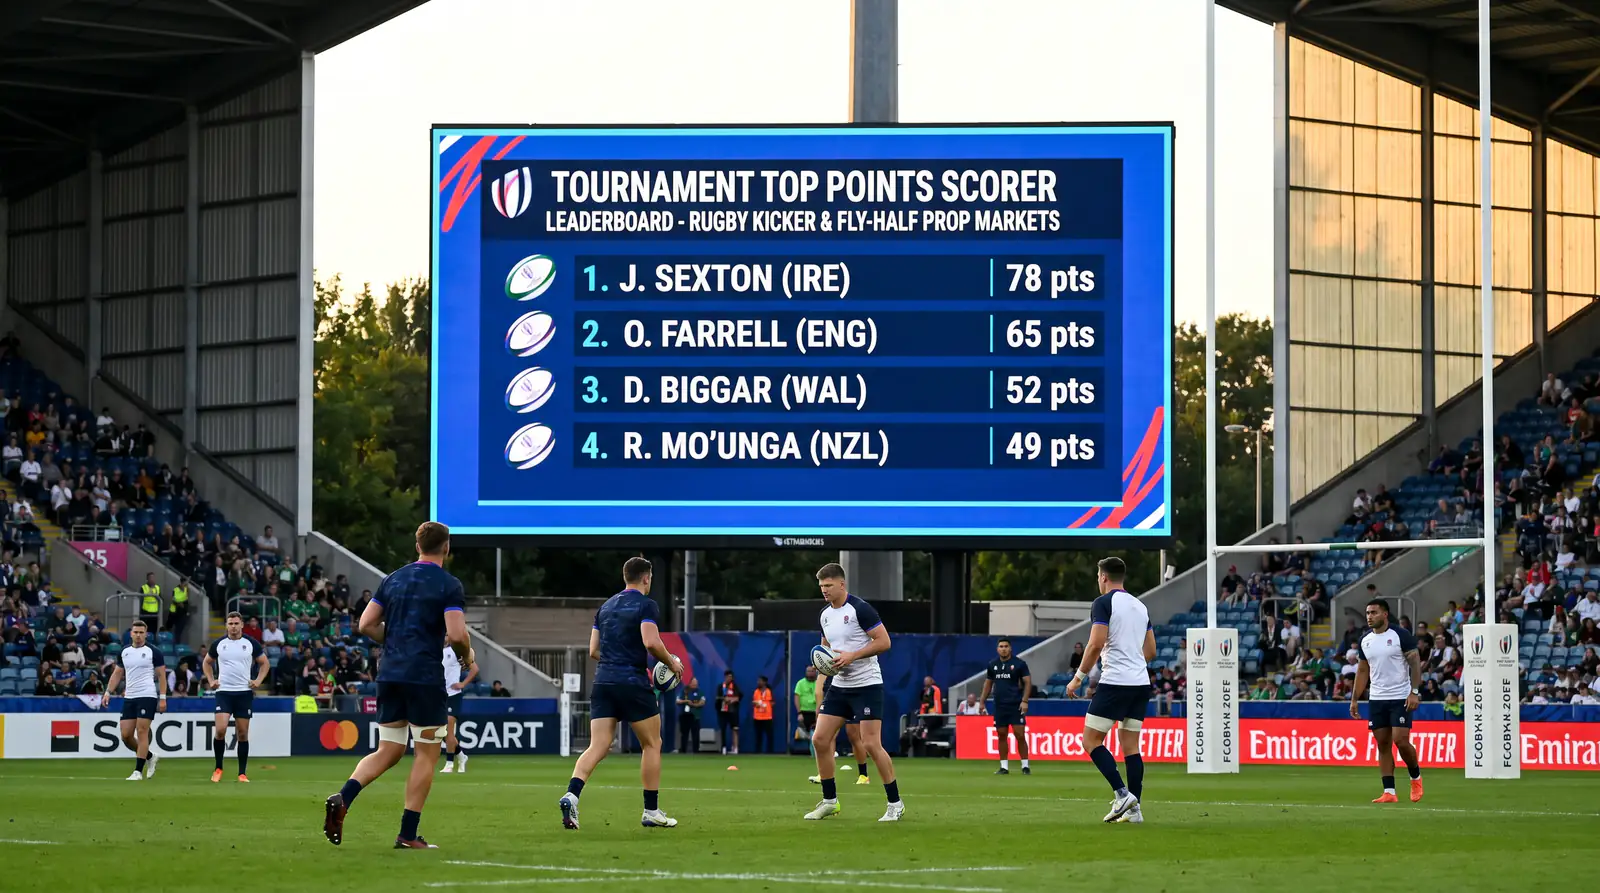
The pricing favours top-tier kickers from sides expected to score the most. The market historically favours the kickers of the top one or two championship contenders, with prices opening at 3.00 to 5.00 on the front-runner and 7.00 to 12.00 on the second favourite. The Six Nations 2025 prize money structure — £6.5 million to champions France, £3.5 million to England — reflects the broader competitive shape that the top points scorer market tracks.
The value sits in two patterns. First, the second-favourite kicker often has better value than the headline price suggests — favouring the front-runner is the demand-driven default, and the market sometimes over-compresses the favourite’s price. Second, kickers from defensive sides with strong penalty-attack patterns sometimes punch above their try-scoring weight on points totals — they earn fewer team tries but more individual points from penalties.
Where these markets fit in a portfolio
Kicker props are a sound diversification add-on to standard rugby betting. The variance is lower than try-scorer markets (kickers score consistently across most matches), the operator margins are reasonable on points-by-player lines, and the correlation with team totals creates bet-builder opportunities. The breadth of UK rugby betting markets — covering union and league from match handicaps and totals through to player props like points by player and drop-goal specials — gives the patient bettor multiple windows to act. Kicker props are one of the better-priced windows once you understand the weather and team-context dependencies. For the closely related weather dimension, see my piece on weather and kicking accuracy.