
Rugby Total Points Betting: Over/Under Lines and the Pace of the Game
 Available in US
The line that tells you everything about how the game will be played
Show me a total points line and I will tell you what kind of rugby the bookmaker expects. A Six Nations match priced at 42.5 is a different game from a Champions Cup pool fixture priced at 58.5. The number is not just a sum of points — it is a forecast of pace, weather, kicking accuracy, and risk appetite by both sides. Totals betting is the closest thing rugby has to a pure read on how the match will be played, not just who will win.
The reliable Six Nations anchor: typical total points lines sit at 42.5 or 45.5 for in-form fixtures. That cluster has been stable for years. Anything significantly higher or lower than the cluster is a signal, and the signal is more often correct than wrong — but not always, and the gaps are where I look for value.
How totals are set
Bookmakers build the total from two team-level inputs: expected points scored and expected points conceded. Those numbers come from offensive efficiency (tries per match, kicking conversion rate, penalty goals attempted) and defensive efficiency (tries conceded, line breaks allowed). Combine the two sides and you get a projected total, which then gets adjusted for venue, weather, and squad changes.

The adjustments matter more than newcomers think. A 45.5 line in benign conditions can drop to 38.5 with confirmed rain forecast and a 25 mph wind. A 42.5 line can climb to 48.5 if both sides are starting their first-choice fly-halves after a rotation week. The opening line is rarely the final line — totals move more than handicaps in the 24 hours before kick-off, because weather data tightens late.
The overround on totals is similar to handicap: typically 105 to 108 percent on a two-way line. That is competitive enough that line shopping pays off across operators, especially when you find one operator using a stale weather forecast.
Union and league: the pace difference
The biggest single factor in totals pricing is which code you are betting. Union sits at lower tries per match on average — the Six Nations sample of 7.4 tries per match in 2026 is roughly typical. League runs faster, with possession alternating every six tackles and fewer set-piece stoppages.
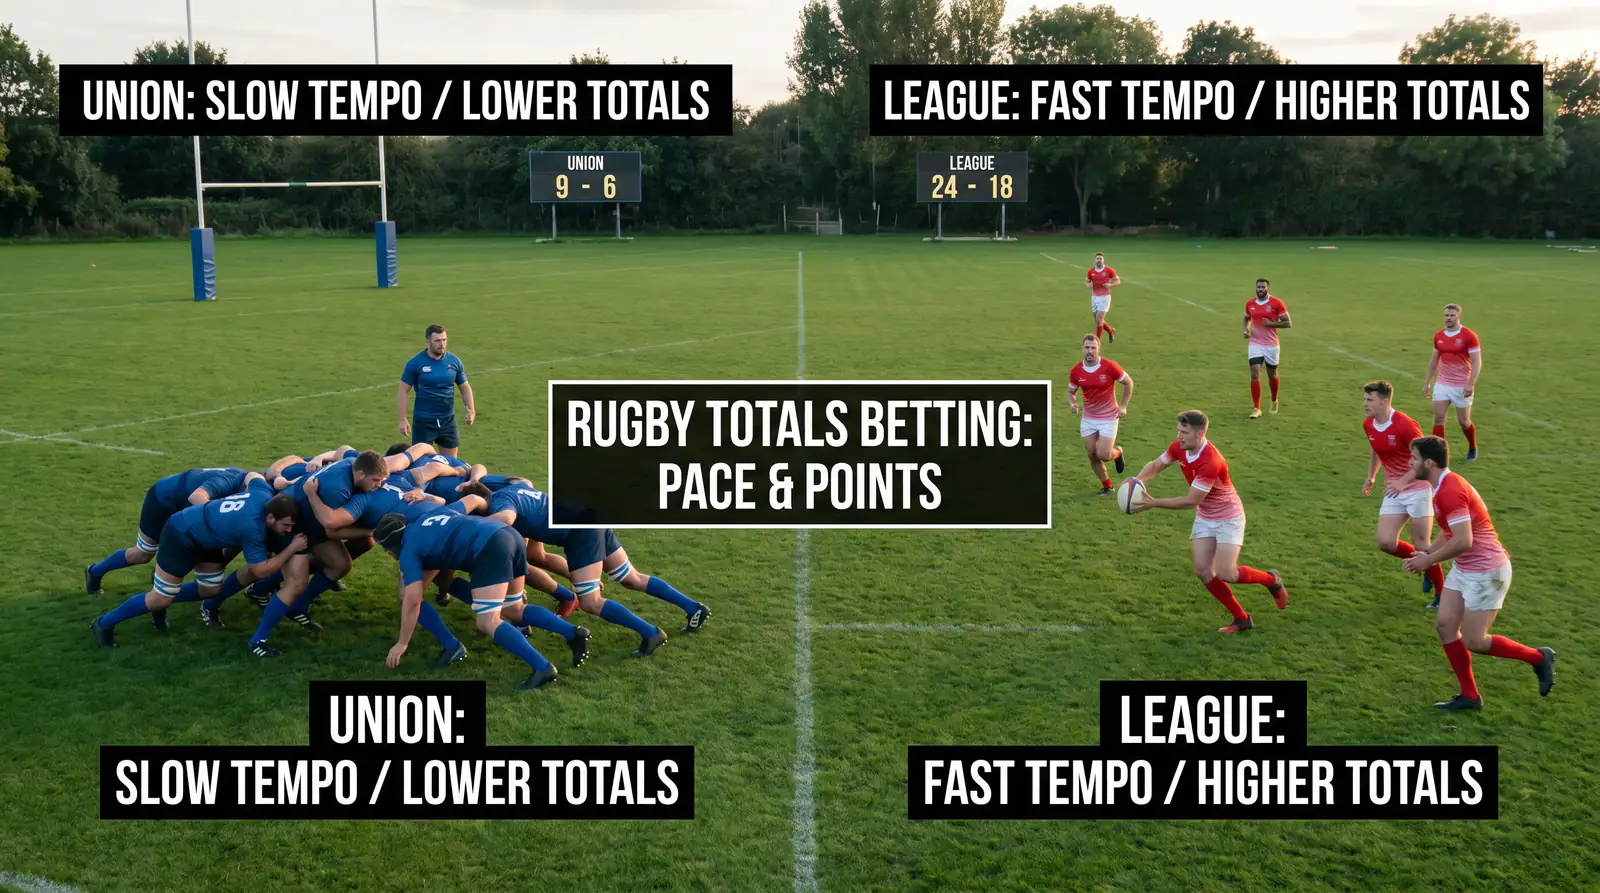
That tempo difference shows up in the line ranges. Super League totals typically run 36.5 to 44.5, with the variance driven by team quality and weather rather than format. Union totals are more variable: 38.5 in a Six Nations defensive grinder, 55.5 or higher in a Champions Cup pool fixture between attacking sides. The variance in union is wider, which means the value windows are wider too.
What I do with the difference: I bet totals more often in union, where the line range is wider and the bookmaker’s model has more variables to get wrong. I bet totals less often in league, where the range is tighter and the model is more accurate per match.
Weather and conditions
Weather is the variable that bookmakers handle worst. The reason is straightforward: weather forecasts update through the week, and bookmaker line-setters do not always rerun their model when the forecast changes. By kick-off the forecast is much more reliable than the forecast was on Tuesday — but the line might still reflect Tuesday’s expectation.

Concrete adjustments I use. Sustained wind over 20 mph reduces totals by 4 to 7 points in union — kicking accuracy drops, set pieces become unstable, and tries from forward dominance fall off. Heavy rain reduces totals by 6 to 10 points and pushes scoring patterns toward forwards. Cold conditions below 5 degrees Celsius reduce totals by 2 to 4 points by depressing ball-handling accuracy without fundamentally changing the game.
Stadium-specific quirks add another layer. Open stadiums with prevailing winds (Murrayfield, BT Sport Welford Road in certain weather) play to lower totals consistently. Indoor or covered venues play to higher totals because conditions are eliminated as a variable.
Live totals trading
In-play totals lines move faster than any other rugby market. A try-line denial in the first five minutes barely moves the total; the same denial at 60 minutes when the line is 45.5 and the current score is 28-13 will shift the live total by 3 points within seconds.
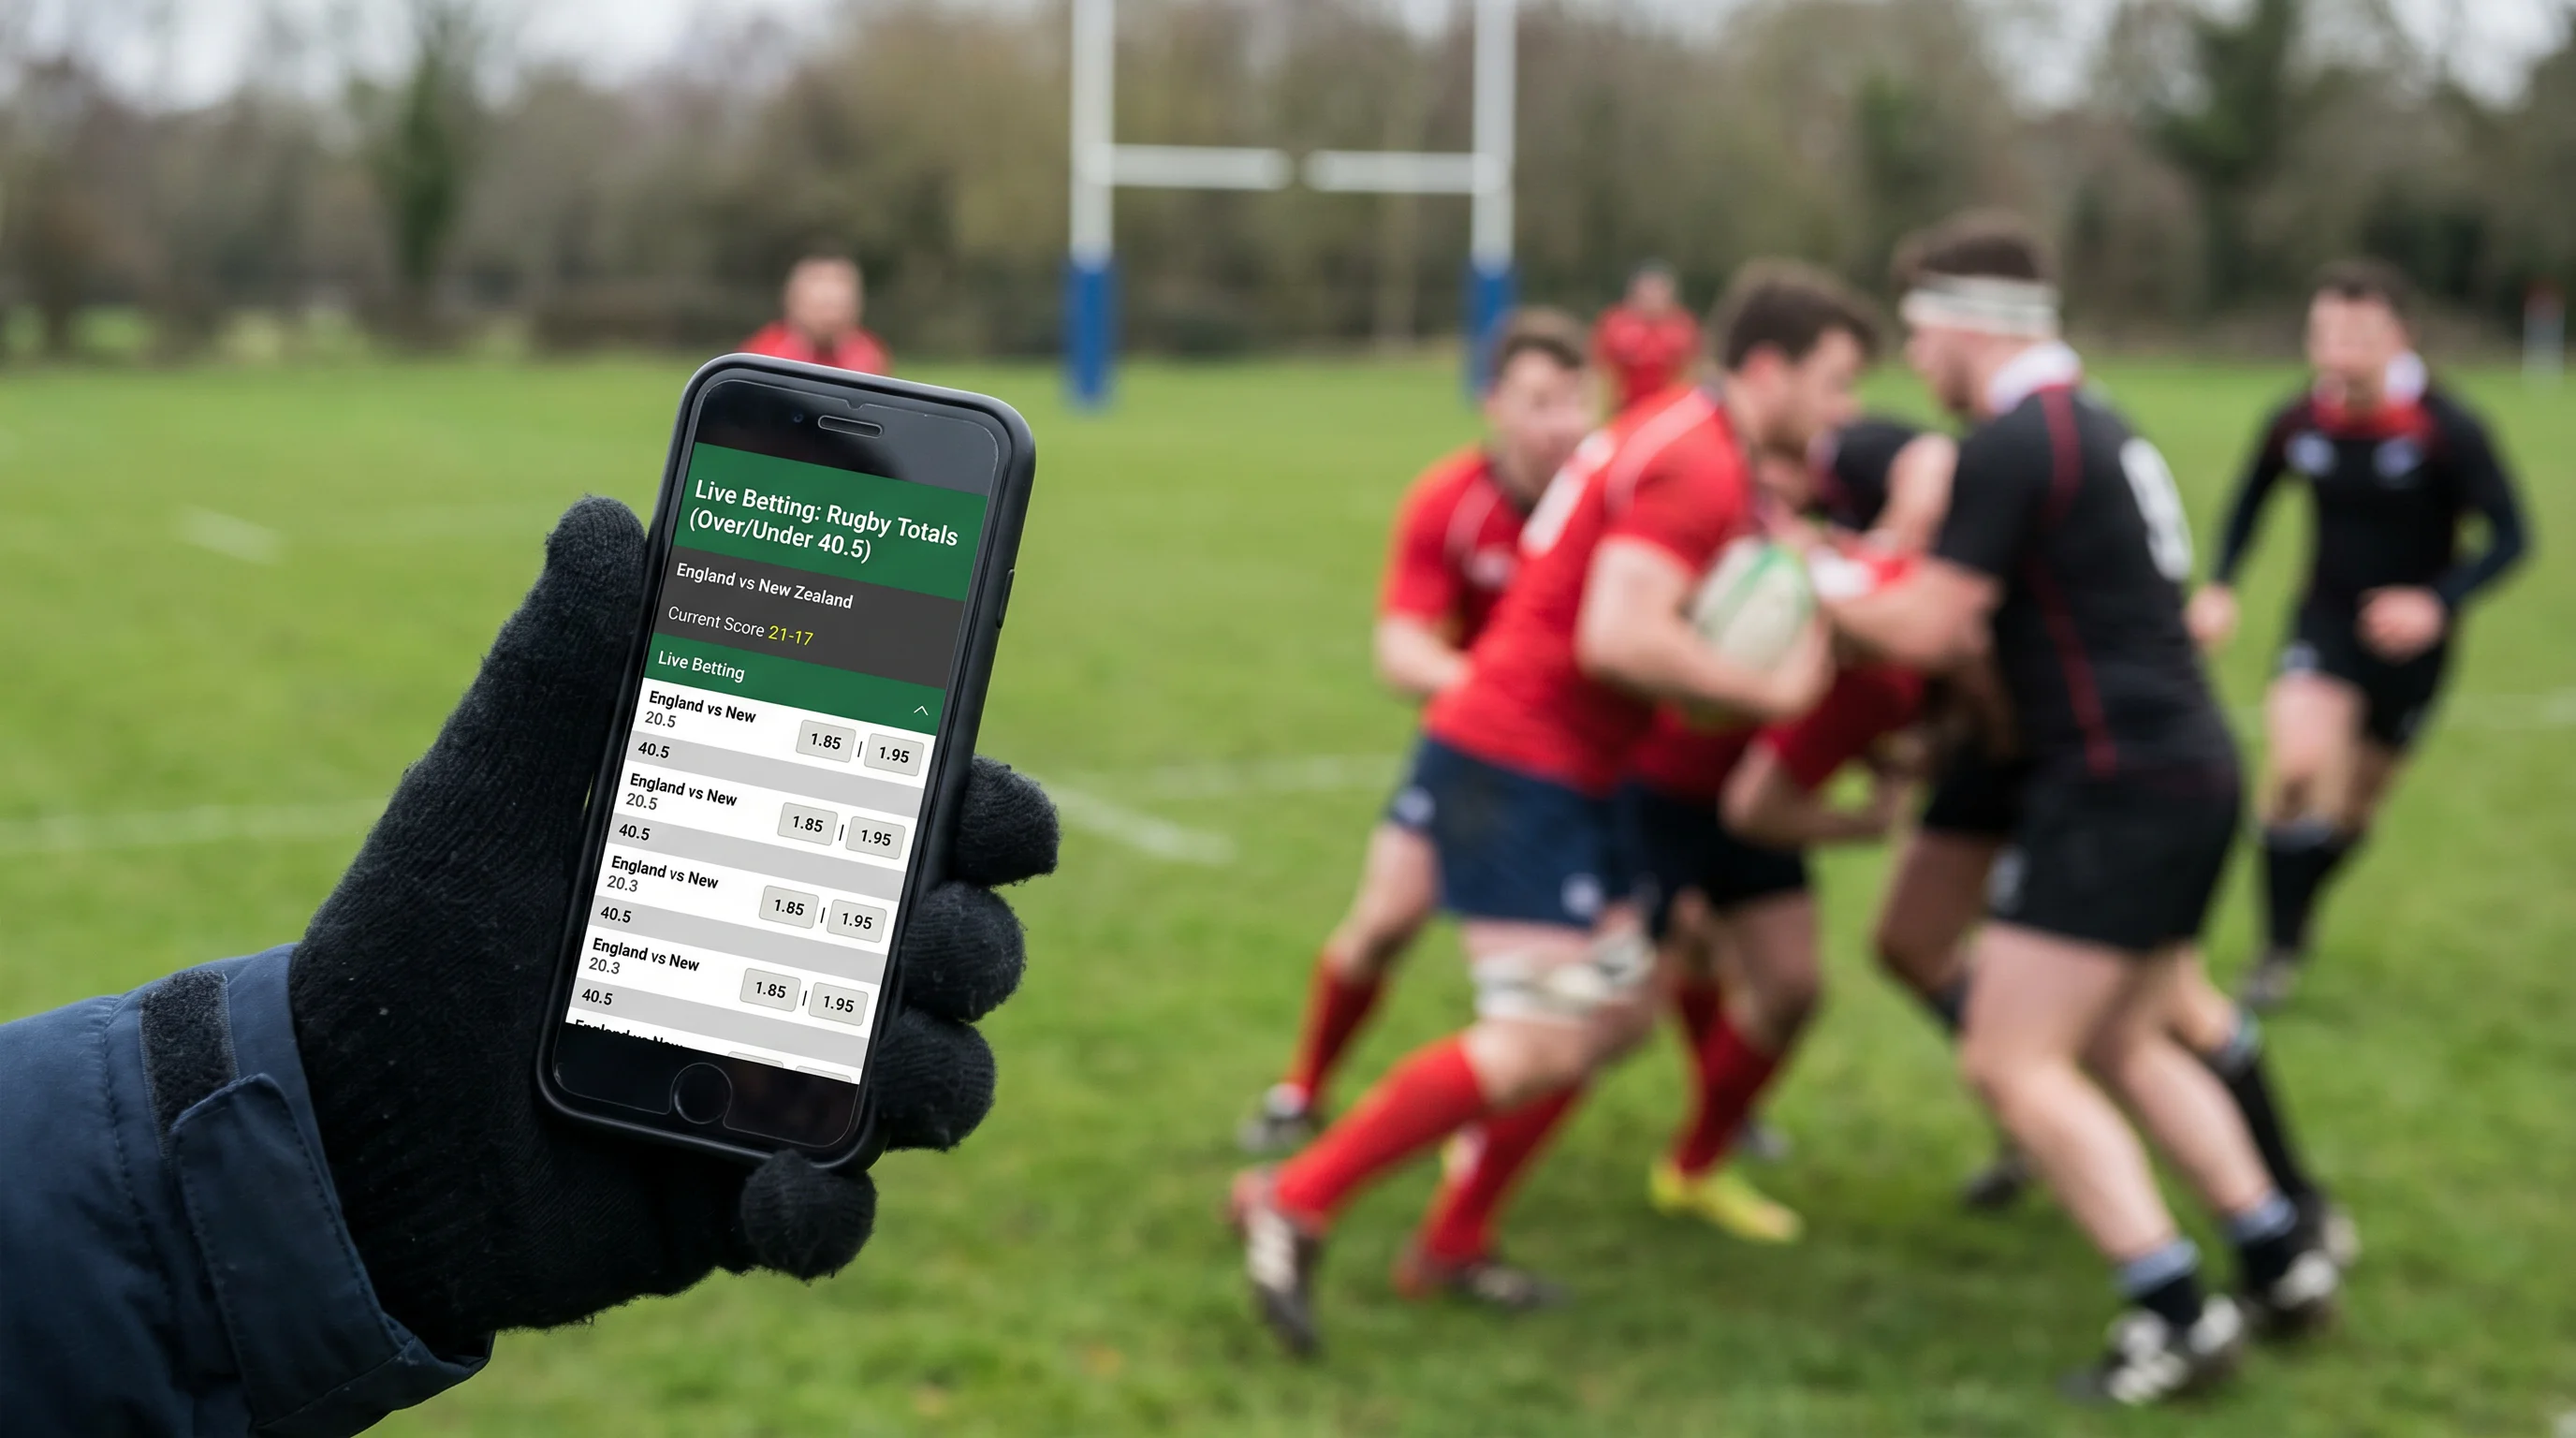
The reliable in-play patterns. Two scores in the opening 15 minutes push the live total up by 4 to 6 points, often too aggressively if the early scores came from a single high-error sequence. A 0-0 scoreline at 25 minutes drops the live total by 8 to 12 points, and this is sometimes an overreaction if the underlying field position is favouring attacks. Sin-bin events shift the live total by 2 to 4 points in favour of the team with the player advantage — that is roughly correct, but specific match contexts can mean the actual edge differs.
The discipline I apply: I do not trade live totals on every match. I pre-flag matches where I expect the line to overreact to early events, and I stake only those. Trying to trade every game burns capital on fees and bad timing.
Historical overs rates by competition
Long-run data is the cleanest sanity check on totals lines. The Six Nations totals line at 42.5 or 45.5 has produced roughly balanced overs and unders over the past decade — meaning the bookmakers have priced the average correctly. The variance comes from individual matches and individual weather windows, not from systematic bias.
The Champions Cup runs differently. With 8.24 tries per match across the most recent season’s 63 matches, the totals lines have to keep up with high-scoring fixtures, and they sometimes fall behind. Overs rates in Champions Cup pool fixtures involving cross-league mismatches have historically run higher than the line would suggest — that is where I have made repeatable money on totals overs.
URC totals at 6.7 tries per match in 2025-26 ran below the Champions Cup. The competition’s totals lines reflect that lower pace, and the model is well-calibrated overall. Where it slips: cross-border fixtures where the bookmaker has applied a generic line without modelling the travel context specifically.
Combining totals with other markets
Totals correlate strongly with other markets, and bet builder pricing does not always reflect that correlation. A 1X2 favourite at -10 and a totals over at 48.5 are positively correlated — both bets win in a high-scoring match where the favourite covers. The combined price should reflect that correlation, and operators that use independent-event multiplication offer better value than operators that model the dependency explicitly.
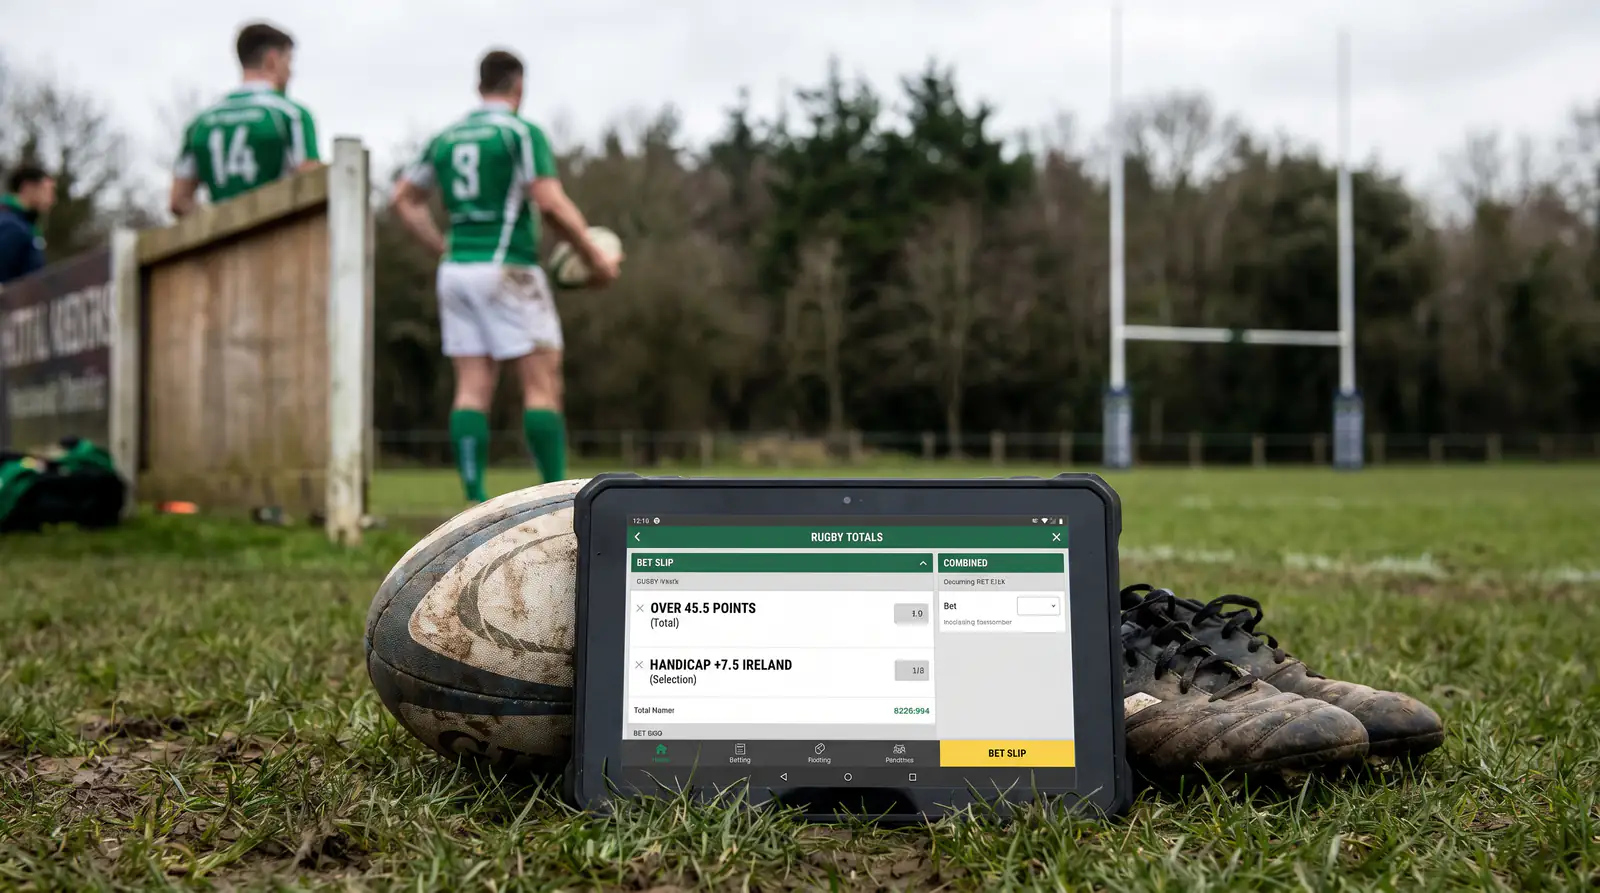
Try scorer markets correlate too. A first-half tries-over bet and a high first try scorer probability are positively correlated. Stacking these in a bet builder can produce edges when the operator under-models the correlation.
The competition that drives most of my totals action
Most of my totals staking happens in the Champions Cup and the Premiership, where the line variance is widest and the weather-handling lags are most reliable. The Six Nations gets less of my totals capital because the line is well-calibrated and the value windows are narrow. The URC sits in between. For weather-specific work, my piece on how weather shapes rugby betting covers the adjustments I run match-by-match.