
Rugby Union vs Rugby League Betting: How Code Differences Shape the Markets
 Available in US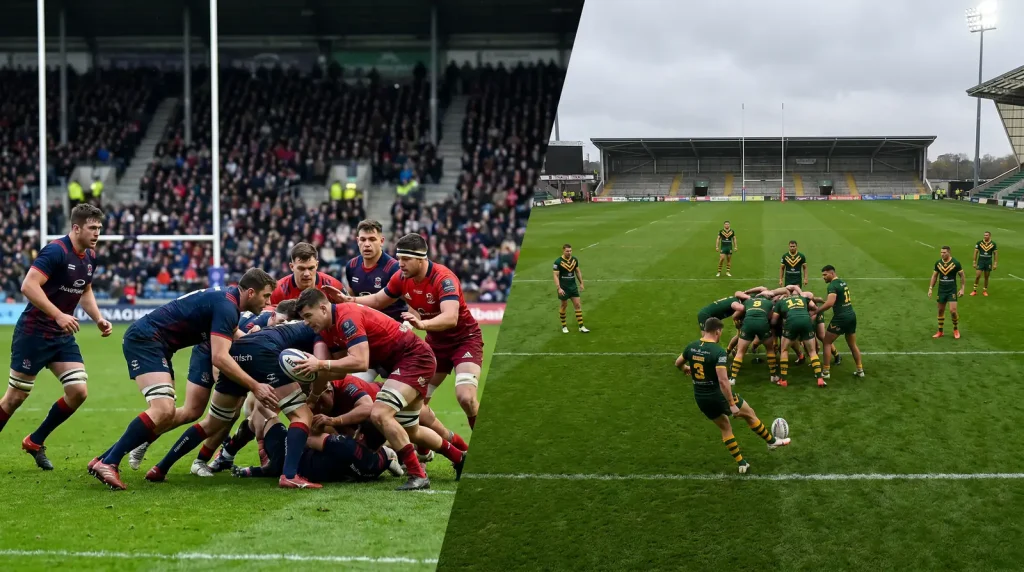
One of the questions I get most often from new punters is some variation of: “Surely the codes are similar enough that I can use the same strategy for both?” The short answer is no. The longer answer is that nearly every market — handicap, totals, tryscorer, in-play — prices differently in union and league for reasons that come straight from the rulebook. I’ve made and lost money on both sides over a nine-year career, and the bettors who treat them as interchangeable are usually the ones donating to the bookmaker.
Union pulls the bigger headline numbers in the UK. The Gallagher Premiership generated roughly £320 million in revenue across the 2025 season, which makes it the largest rugby union league in the world by income. The Sky Sports contract alone pays £180 million annually. League’s economic footprint is smaller in pure financial terms but the betting handle on Super League rounds is dense, focused, and often more punter-friendly because the markets behave more predictably.
Before getting into the specifics, one framing point. Most UK punters arrive at rugby betting with a default mental model that comes from one code — usually whichever they grew up watching. That single-code model is a starting point, not an answer. The differences I’ll work through below are not academic distinctions; they’re the practical reasons why a winning union punter can be a losing league punter without ever changing their stake sizing.
Rules differences that show up directly in the lines
I’ll start with the rule differences that actually matter for pricing. Union plays fifteen players a side; league plays thirteen. That two-player gap removes the flankers and creates more open running space, which means league matches typically have higher try counts but lower point totals per try than union, because a league try is worth four points rather than five and the conversion rate landscape differs between the two codes.
The breakdown is the other structural divide. Union has the ruck and maul — slow phases where possession can be contested. League has the play-the-ball, a more structured set-piece where the defending team retreats ten metres and possession is essentially guaranteed for the attacking side over a six-tackle set. That set-piece structure makes league matches more rhythmically predictable. Possession changes hands roughly every six tackles. Bookmakers know exactly how many possession changes to expect in a typical league match. Union, with its contested breakdowns and turnover possibilities, has a higher variance in possession share.
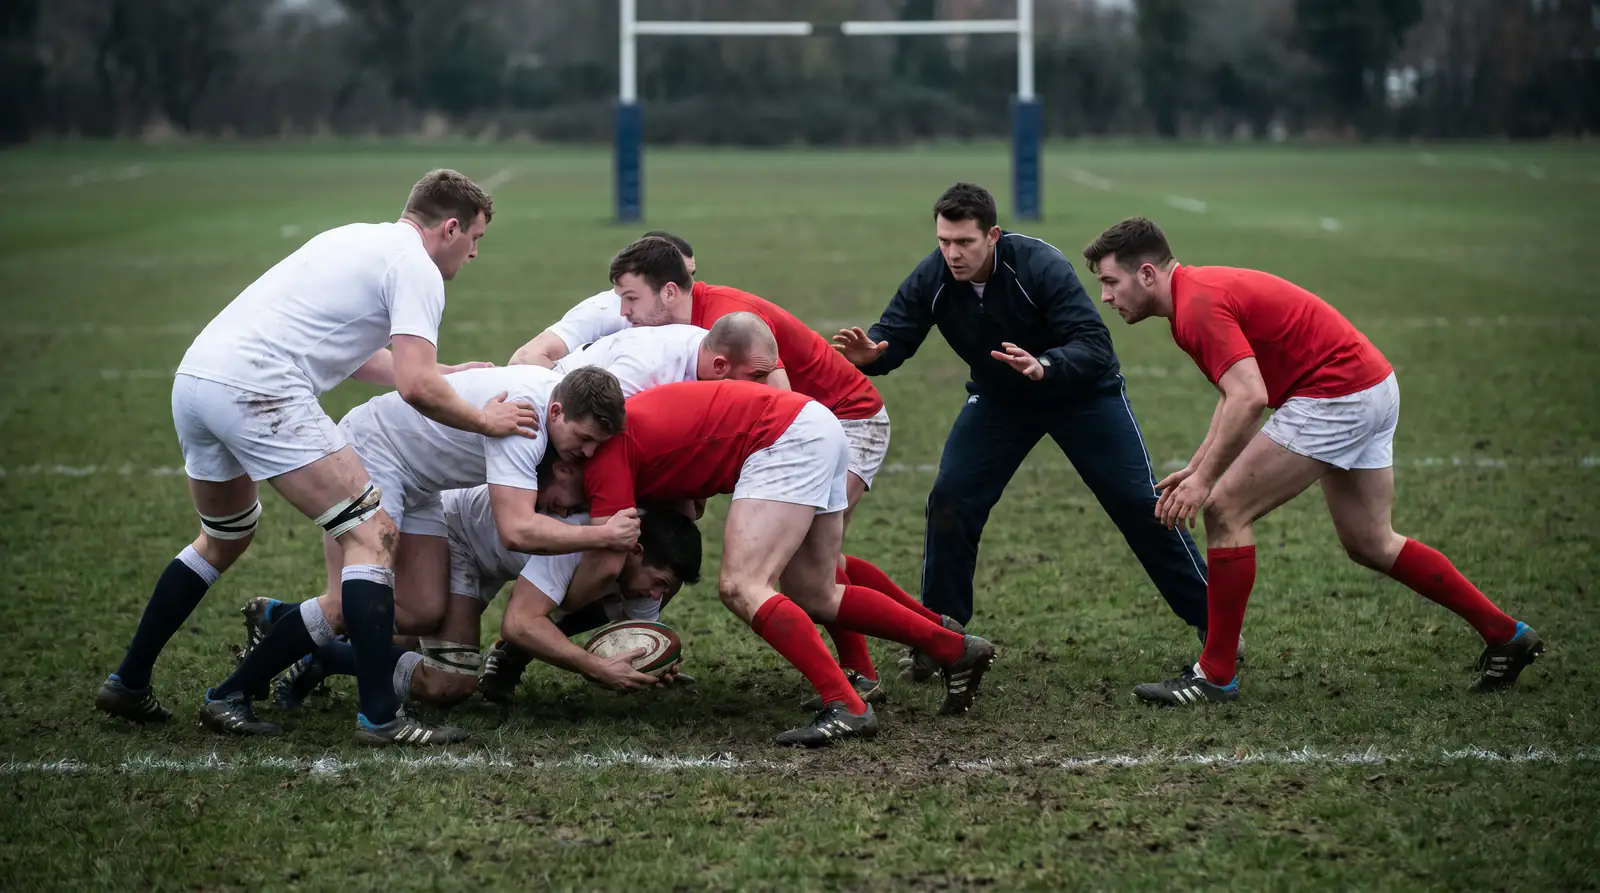
Scoring values also differ. A union try is worth five points; a league try is worth four. Union conversions are worth two; so are league conversions. Union has the penalty goal (three points) and the drop goal (three points); league has the penalty (two points) and the drop goal (one point). Those scoring differences mean the same number of tries produces fewer points in league than in union, which is why league totals lines tend to sit lower in absolute terms despite the higher try counts.
The match length also differs in feel even though both codes run eighty minutes. Union’s stoppage time and reset clock means an eighty-minute union match often runs 95-100 minutes of real time. League runs closer to its nominal eighty because the play-the-ball restarts faster and there are fewer scrum resets. From a bettor’s standpoint, that means league in-play markets settle faster and there’s less time to react to mid-match developments.
Substitutions are another structural variable that filters into pricing. Union allows up to eight replacements with specific rules around the “front-row covering” requirement. League allows ten interchanges per side with no positional restrictions. That replacement flexibility means league sides cycle their pack throughout the match, keeping defensive intensity high in the last quarter. Union sides also rotate, but the so-called “bomb squad” approach — bringing fresh forwards on at 50 minutes — creates a much sharper inflection point in the match. That inflection is something live punters need to anticipate by code, because the cadence of impact is genuinely different.
Penalties play out differently as well. Union penalties at goal contribute three points each and accumulate quickly when a referee is in a strict mood at the breakdown. League penalties pay two points if kicked but more commonly get tapped and run, because the territorial advantage of a kick to touch isn’t as decisive in a code where possession recycles every six tackles. Knowing how a specific referee handles penalty calls is a stronger input in union totals modelling than in league.
Handicap lines and the code-by-code spread
Typical handicap lines in a Six Nations union fixture sit between -3.5 and -14.5 with the bulk clustering around -7.5 to -10.5. The total points line typically sits at 42.5 or 45.5. Now compare that to a Super League fixture between a top-four side and a mid-table opponent: handicaps usually run -4.5 to -12.5 with totals around 38.5 to 44.5. Similar ranges on paper. Very different underlying maths.
The reason league handicaps tend to look slightly tighter than union handicaps is the lower variance in possession share. When both teams get roughly equal time with the ball, the gap between sides expresses itself more cleanly through execution rather than dominance. Union mismatches can blow out — a 50-point handicap cover is not unusual in a Tier 1 vs Tier 3 international — because the better side simply doesn’t lose possession. League blowouts happen, but they’re capped by the structural fact that the trailing side gets the ball back every six tackles regardless of how the match is going.
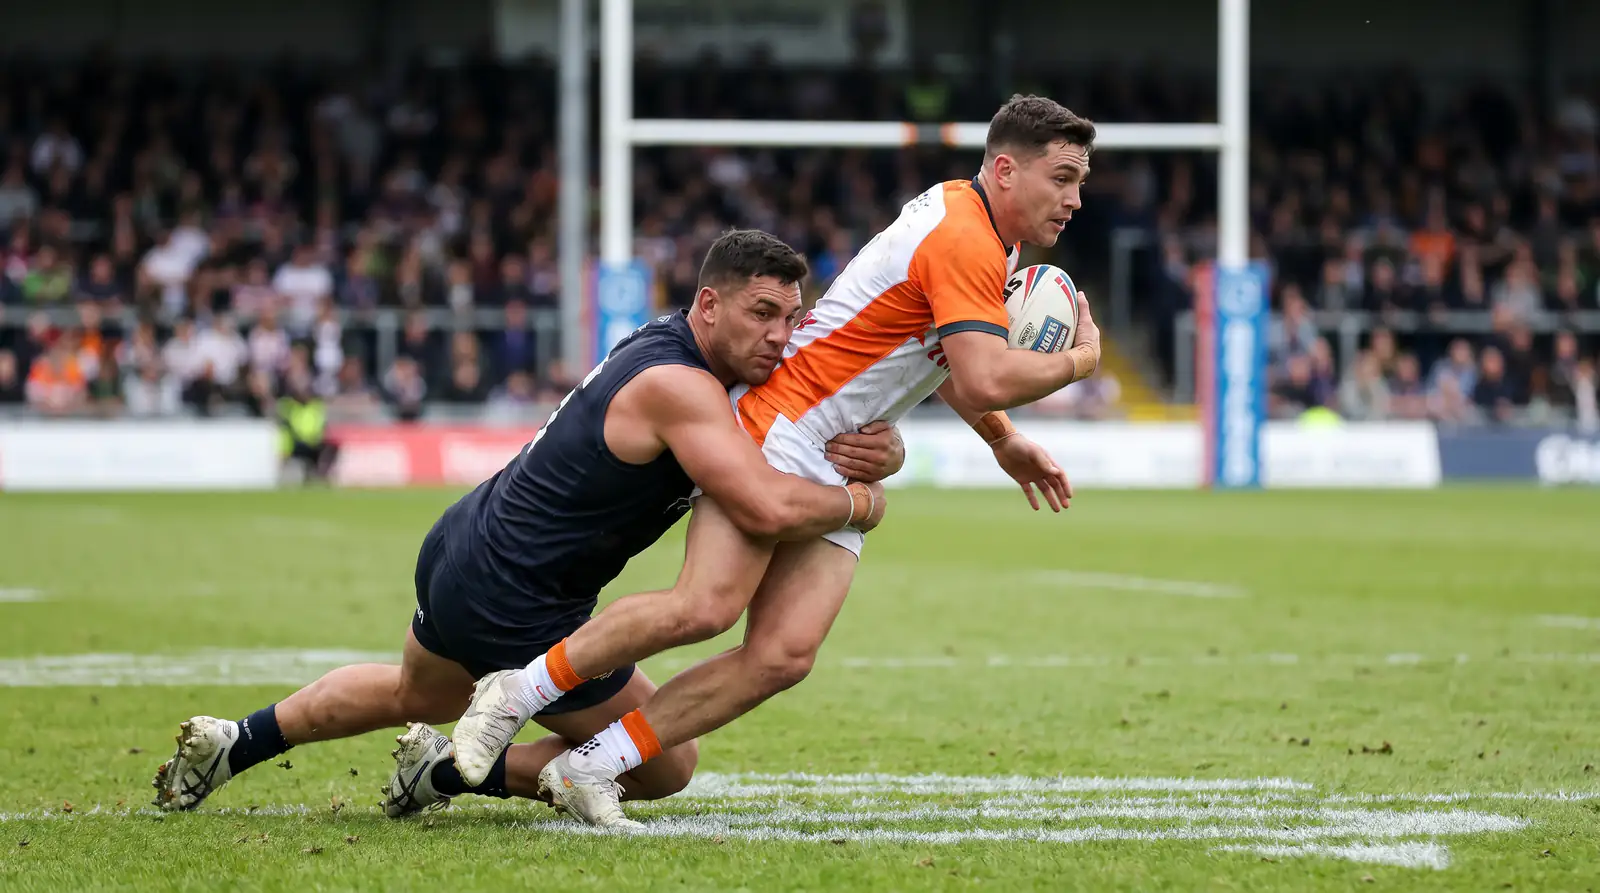
That has practical consequences for handicap shopping. In union, the underdog plus the points is often the safer side of the line because mismatches rarely sustain over the full eighty minutes — fatigue, yellow cards, and ruck contests eventually slow the dominant side down. In league, the favourite to cover is often the cleaner bet because the dominant side keeps converting possession into points at a steadier rate.
Totals pricing across the codes
Union totals lines respond strongly to weather, refereeing emphasis, and squad selection. Wet weather drops the line by 6-10 points compared to a dry forecast. A referee known for blowing more breakdown penalties pushes the line up because penalty kicks at goal accumulate. A side that’s rested kickers or selected an inexperienced fly-half drops the line because conversion accuracy falls.
League totals are more stable. The 42-tackle set-piece structure means scoring chances accumulate at a more predictable rate. Weather still matters — heavy rain produces more dropped balls and fewer completed sets — but the impact is smaller in magnitude. A wet weather forecast in Super League might move a total from 41.5 to 38.5; the same forecast in union might move a total from 45.5 to 39.5.
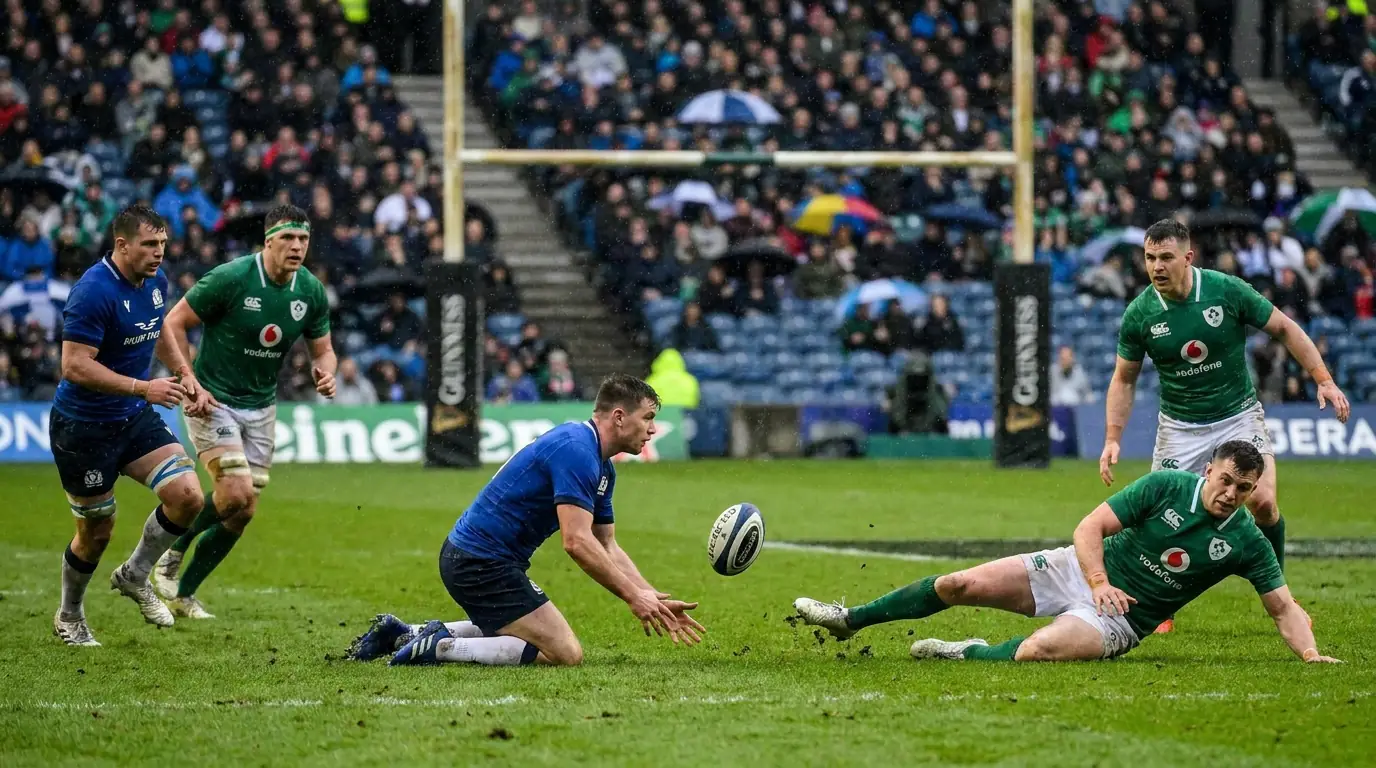
That stability cuts both ways. Predictability means league totals are harder to beat by reading weather correctly, because the bookmaker has already priced in the smaller impact. Union totals are more volatile, which means the punter who reads conditions well finds more edges, but it also means the punter who reads conditions badly loses more often.
There’s also a stadium-specific layer to totals pricing in both codes. Twickenham produces lower totals than Allianz Stadium in the same weather conditions because of how the wind funnels at one end. Old Trafford produces higher Super League totals than the average regular-season ground because the surface plays faster. These ground-level effects are small in any single match, but over a full season they accumulate into meaningful pricing patterns that bookmakers eventually catch up to. Spotting them early is one of the genuine micro-edges available to anyone willing to track totals performance by venue.
Try scorer markets in each code
This is where the codes diverge most sharply for prop bettors. In union, Six Nations 2023 data showed 66% of tries scored by backs — wingers, centres, and full-backs. That bias makes anytime tryscorer pricing in union heavily weighted toward outside backs. Forwards get longer prices because they only score off rolling mauls and pick-and-go phases near the line.
In league, the positional distribution is different. Wingers still score a lot of tries — the structural geometry of the field rewards the player on the outside who finishes the move — but forwards score more frequently than in union because the play-the-ball means hookers, props, and second-rowers can crash over from close range without contested rucks slowing them down. League hookers, in particular, score more tries per season than any union hooker on a points-per-game basis.
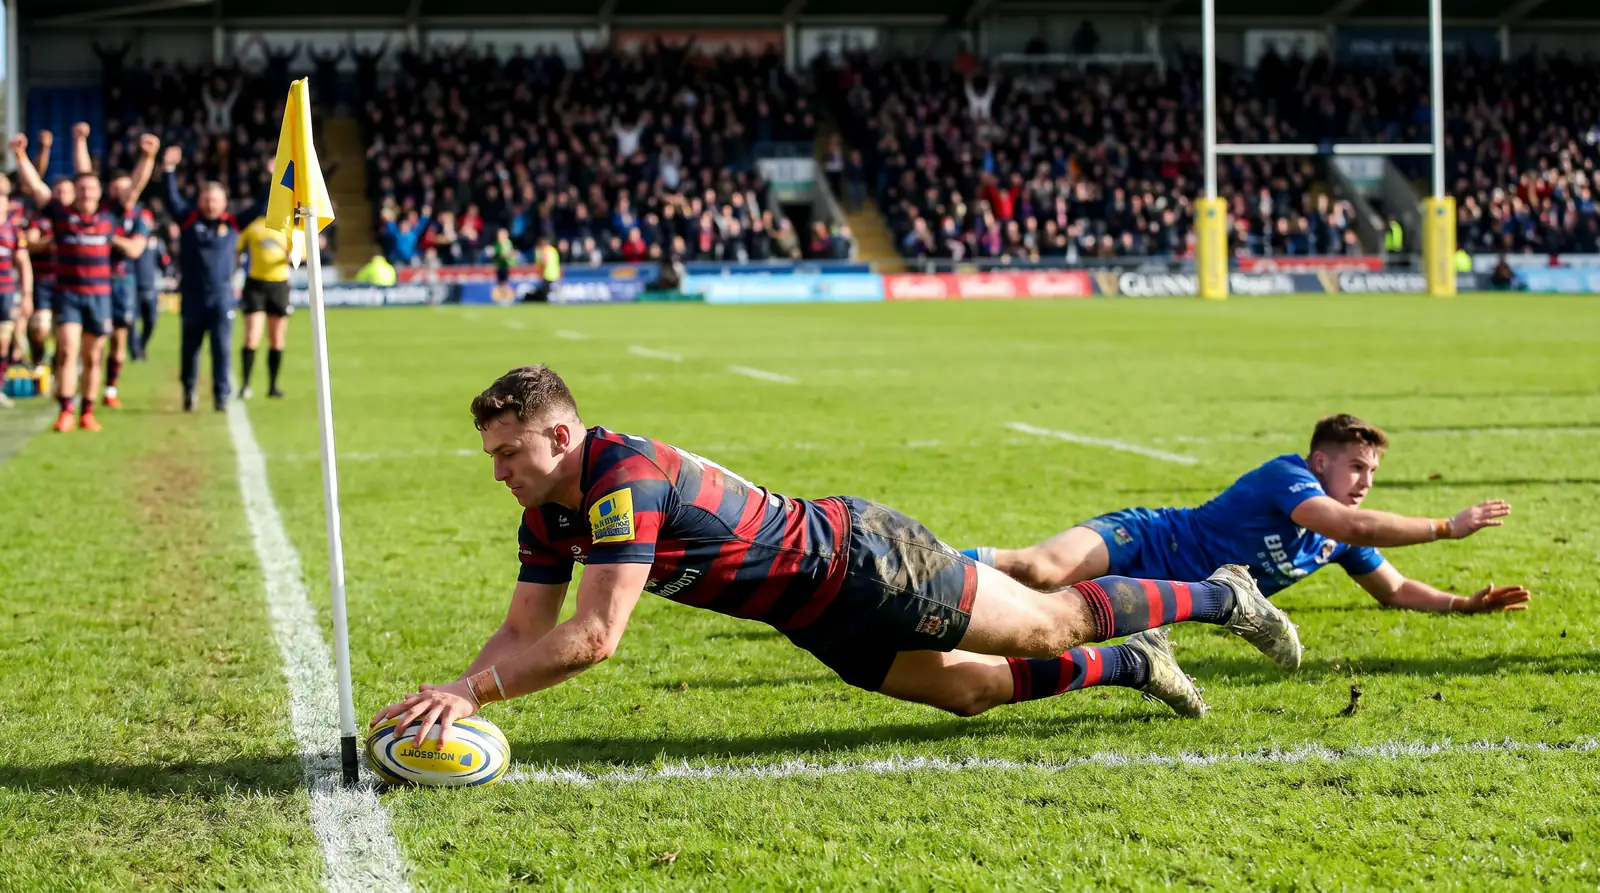
That positional difference means a punter copying their union tryscorer logic into a league fixture will systematically over-back wingers and under-back middle forwards. The opposite mistake — betting league logic in union — over-backs forwards on pick-and-go calls that rarely come through. Read the team sheet by code, not by player.
Charlon Muscat, a casino and sports betting expert at FIRST.com, summarises the cross-code market landscape well: “The best rugby betting sites in the UK cater to both union and league fans, spanning competitions like the Rugby World Cup, Six Nations, Gallagher Premiership, Super League, and Challenge Cup. You can stream matches, claim bonuses, and explore markets such as handicaps, first try scorer, winning margin, and total points.” The point is that the markets are nominally the same — but the pricing dynamics behind those markets vary considerably by code.
League finances, union finances, and how that filters into betting
The Gallagher Premiership at £320 million in revenue and £180 million in annual Sky Sports rights is operating at a financial scale that makes its betting markets among the most liquid in northern hemisphere rugby. The Rugby Football Union itself reported £228 million in revenue for the 2024/25 financial year, up 30% on the previous year, which underscores how much money flows through English union at the federation level alone.
Super League’s revenue base is smaller in absolute terms. The combined betting and gaming sector pays significant rights and sponsorship fees into rugby league through cross-sport agreements, and the BGC’s EY-led analysis put the snooker, darts, and rugby league combined at £12.5 million-plus in 2024 from regulated sector contributions alone. That smaller financial footprint produces a different operational reality for clubs and, through them, for betting markets.
Why does this matter for punters? Because club financial health affects squad continuity, recruitment, and end-of-season motivation. Premiership clubs operating on tight margins — Bill Sweeney at the RFU acknowledged that “this has been a year of progress amid challenges” in his most recent annual report — sometimes ease off in mid-table fixtures once safety is mathematically secured. League clubs facing relegation play with their hair on fire right to the final whistle. Knowing which financial pressure applies to which fixture is a free input for your handicap modelling.
Sponsorship money is another input that filters into team behaviour. The current generation of UK union and league clubs derive significant revenue from shirt sponsorship, much of it from regulated gambling operators. That sponsorship base is starting to shift as the cross-sport voluntary code unfolds, and clubs adapting to the new landscape will have to find replacement revenue. Punters who track which clubs are vulnerable to revenue disruption can read end-of-season motivation patterns more sharply than the general market.
Competition calendars side by side
The 2025-26 URC season ran 148 matches with combined attendance of 1,620,340 and an average of 10,948 per match, producing 988 tries at 6.7 per match. The Gallagher Premiership over the same period played 85 matches at the time of measurement with 732 tries at 8.6 per match — a meaningfully higher try rate than URC, which tells you something useful about pace and openness in domestic English union.
Super League runs a regular season from February to September, with the Grand Final at Old Trafford in October. The Challenge Cup runs alongside as a knockout competition with its own final at Wembley. That structure gives league bettors a year-round product with two distinct knockout climaxes, which makes long-term tournament prop markets more accessible than in union.
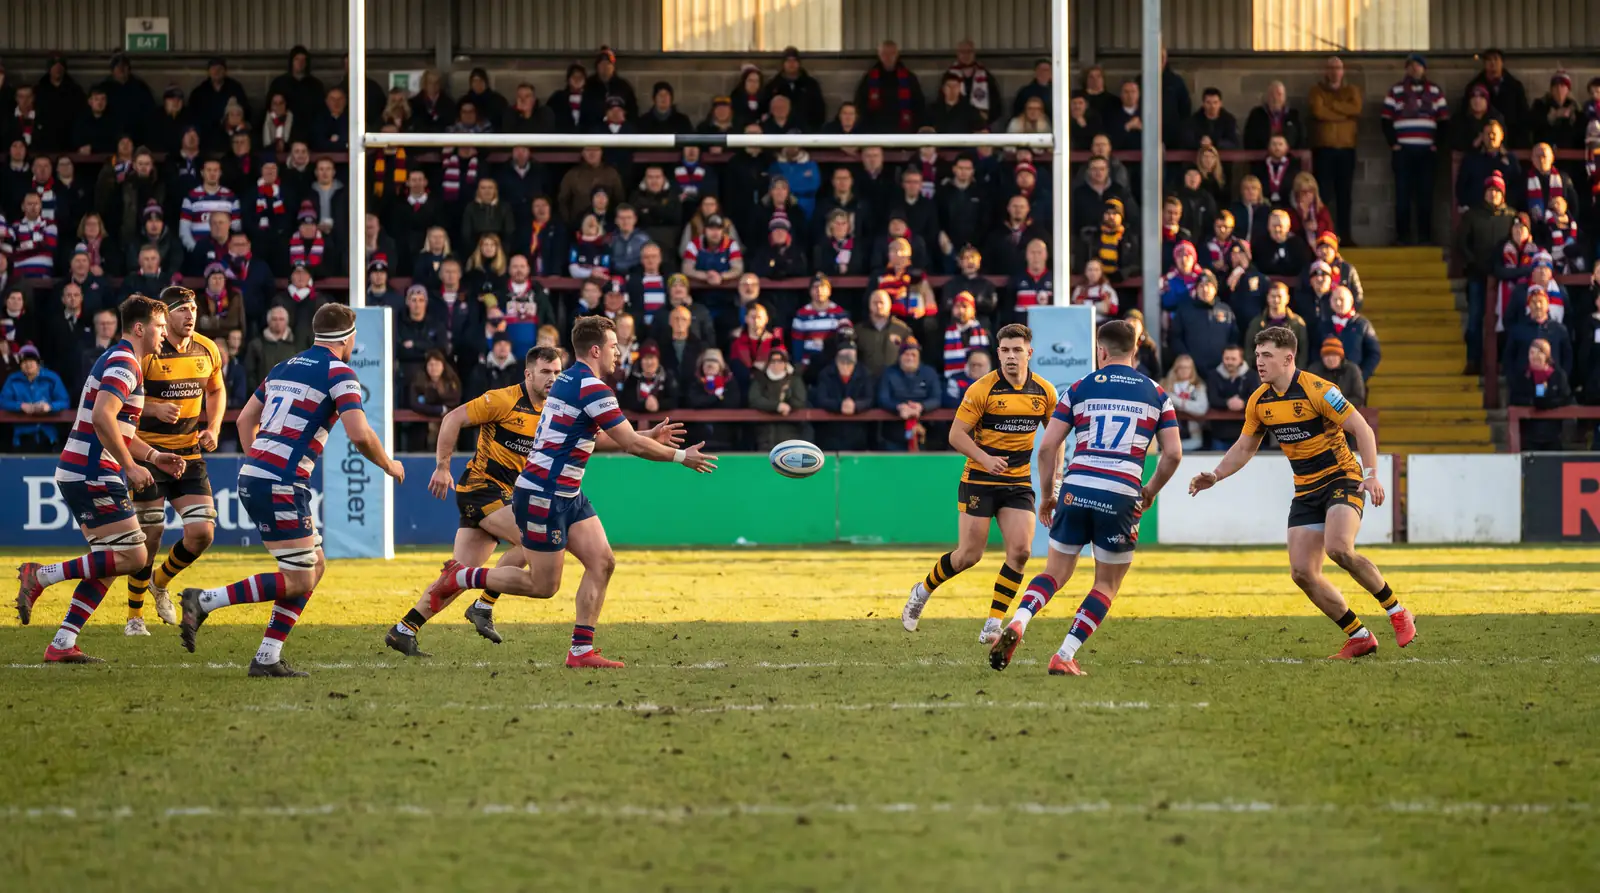
Union’s calendar is more fragmented. Premiership runs domestically from autumn to early summer with the Champions Cup and Challenge Cup operating in parallel as the European tier. Internationals interrupt with autumn series, Six Nations in February-March, and summer tours. The fragmented schedule means union punters have to track three or four overlapping competitions simultaneously, where league punters can focus on one or two primary leagues at a time. For a deeper read on rugby league’s domestic top tier, my Super League betting deep dive notes are where I work through the specifics.
Cross-code events and the niche markets they create
Cross-code matches — actual exhibition fixtures between union and league sides played under hybrid or alternating-half rules — are rare these days. The last major cross-code event in the UK predates the betting era most current punters operate in. But the concept of cross-code markets persists in three forms that are worth understanding.
First, “code switcher” specials. When a high-profile player moves between codes — Sonny Bill Williams in earlier years, more recently any name with a strong international profile — bookmakers price specials around international caps in the new code, tryscorer markets in their debut season, and “to return to original code” propositions. These are novelty markets, but they sometimes carry surprisingly soft pricing because the bookmaker is operating on limited recent precedent.
Second, hybrid accumulators. Plenty of UK bookmakers let you build cross-code accas — a Six Nations match selection combined with a Super League weekend leg. These work mathematically the same as same-code accas, but the correlation effects are different because the underlying competitions don’t share player pools, refereeing, or weather conditions. Cross-code accumulators are actually cleaner to model than same-code multis from a correlation perspective.
Third, top tryscorer markets across overlapping seasons. When the Gallagher Premiership and Super League seasons overlap, you can sometimes find specials offering tryscorer prices on players in both leagues with prices that reflect bookmaker assumptions about cross-code form. These are rare and short-lived markets, but they exist.
The discipline of betting both codes well
If you want to bet seriously across union and league, the discipline is to maintain two separate mental models — and ideally two separate spreadsheets. The data you collect on Gallagher Premiership tryscorer rates doesn’t apply directly to Super League. The handicap behaviour you observe in Six Nations doesn’t translate cleanly into Round 14 of the Super League regular season. Treat each code as its own pricing environment, with its own variance characteristics, weather sensitivities, and selection patterns.
The bettors I’ve watched succeed across both codes share one habit: they specialise. They build deep expertise in one league first — usually Gallagher Premiership or Super League — and only expand into the other code once they’ve reached competence in the first. The temptation to bet everything that’s on the screen is what drains bankrolls. Picking your spots, by code and by competition, is what builds them.
The second habit is staying current with rule tweaks. Both codes amend their laws regularly — the union breakdown emphasis cycles every few seasons, and league has introduced changes around the six-again rule and the high tackle that have materially shifted scoring patterns in recent years. A handicap model calibrated against last season’s data will lag the actual line if the laws of the game have moved. Open the World Rugby and RFL law updates at the start of each season and read them. It takes thirty minutes and it pays for itself within the first month.
The third habit is treating cross-code knowledge as additive, not interchangeable. The best union analysts I know can describe what a Super League side does well even if they never bet on it. The best league analysts can articulate why a particular Premiership fixture is mispriced even if they don’t have a stake on it. That breadth keeps your thinking flexible and prevents the tunnel vision that makes punters confident in selections that don’t deserve it.
If you take only one thing from this comparison, let it be this: union and league are different sports that share a name. Treat them like cricket and baseball — related, but with distinct disciplines and distinct edges. The punters who internalise that difference are the ones who quietly profit from both.
