Rugby Bookmaker Payout Percentage: How Margins Are Calculated
 Available in US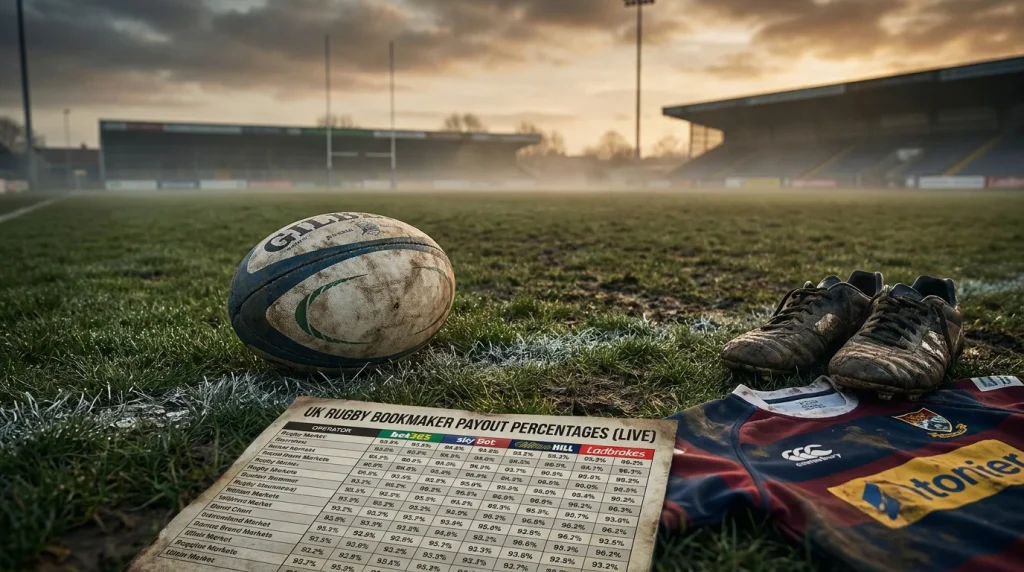
The number every bettor should know and almost none does
I have a habit of asking newer bettors what payout percentage means. The honest answer rate is below 20 percent. Most know “overround” or “vig” as concepts but cannot calculate either from a price slip. This matters because payout percentage is the single cleanest measure of how expensive a bookmaker is to bet with, and the range across UK rugby operators is wider than newcomers expect — typically 93 to 98.5 percent.
A 5 percentage-point gap might sound trivial. Compounded across hundreds of bets a season, it is the difference between a model that works and a model that loses to operator margin. The discipline of checking payout percentage before staking is unglamorous and it works.
Book percentage formula
Book percentage is the sum of implied probabilities across all outcomes in a market. For a two-way market (handicap, totals over/under), it is 1/price A plus 1/price B. For a three-way market (1X2 with the draw), it is 1/price A plus 1/price draw plus 1/price B.
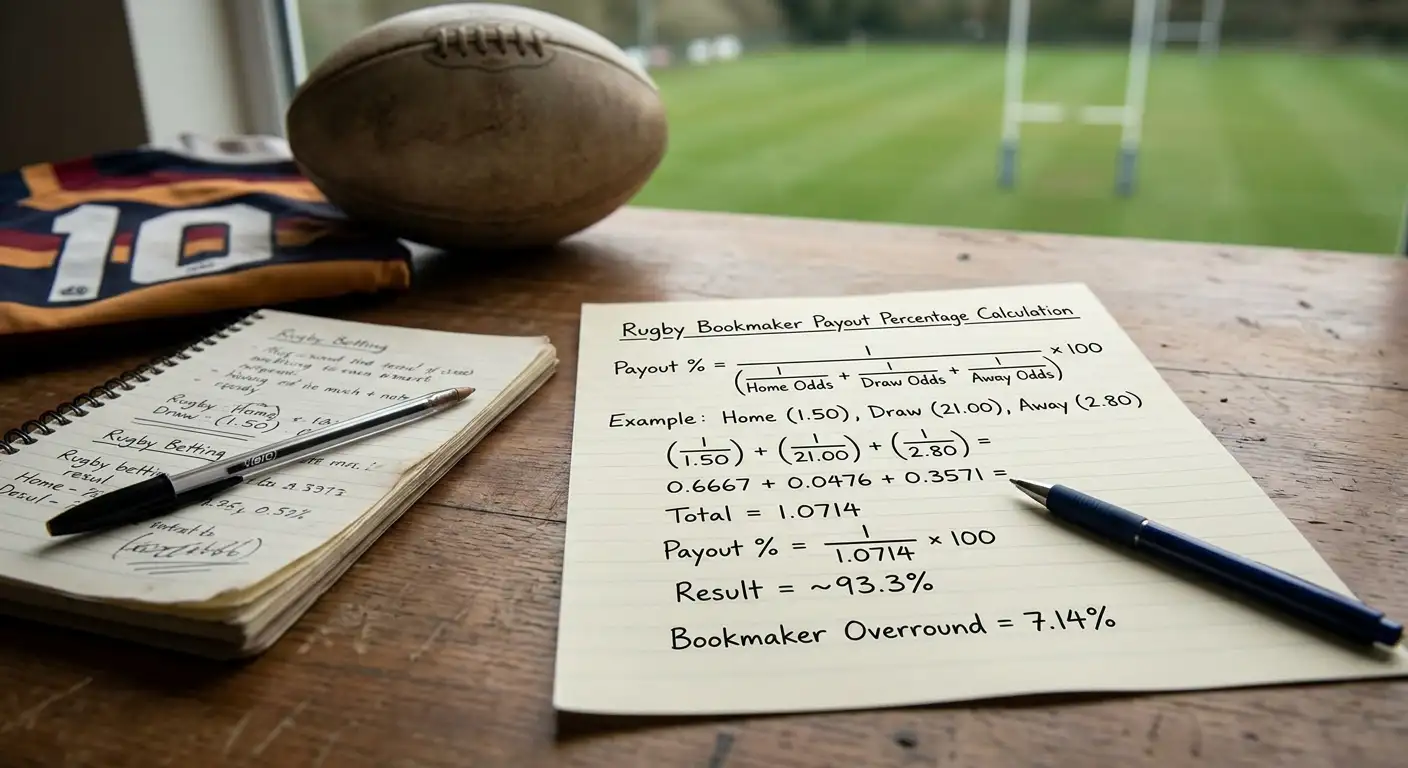
A perfectly priced market with no operator margin would have a book percentage of exactly 100 percent. Real markets always sum higher — the excess above 100 percent is the operator’s overround. A market with book percentage of 105 percent has a 5 percent overround; the payout percentage is 100 divided by 1.05, which is roughly 95.2 percent.
The conversion: payout percentage equals 100 divided by book percentage. A 105 percent book gives 95.2 percent payout. A 110 percent book gives 90.9 percent payout. A 102 percent book gives 98 percent payout. The relationship is non-linear at the margins, which is part of why operators report book percentage internally and payout percentage in marketing — the marketing-friendly number is the inverse.
For a worked rugby example. A Six Nations handicap market with home -7.5 at 1.91 and away +7.5 at 1.91. Implied probabilities: 52.4 percent each, summing to 104.7 percent. Payout percentage: 100/1.047 = 95.5 percent. The operator’s margin on this market is 4.5 percent, charged proportionally to whichever side wins.
Payout ranges by market type
Payout percentage varies systematically by market type. The highest payouts (lowest margins) appear on 1X2 markets in marquee fixtures — often 97 to 98.5 percent. The lowest payouts (highest margins) appear on outright winner markets across many teams and on player props with many candidates — sometimes as low as 85 to 88 percent.
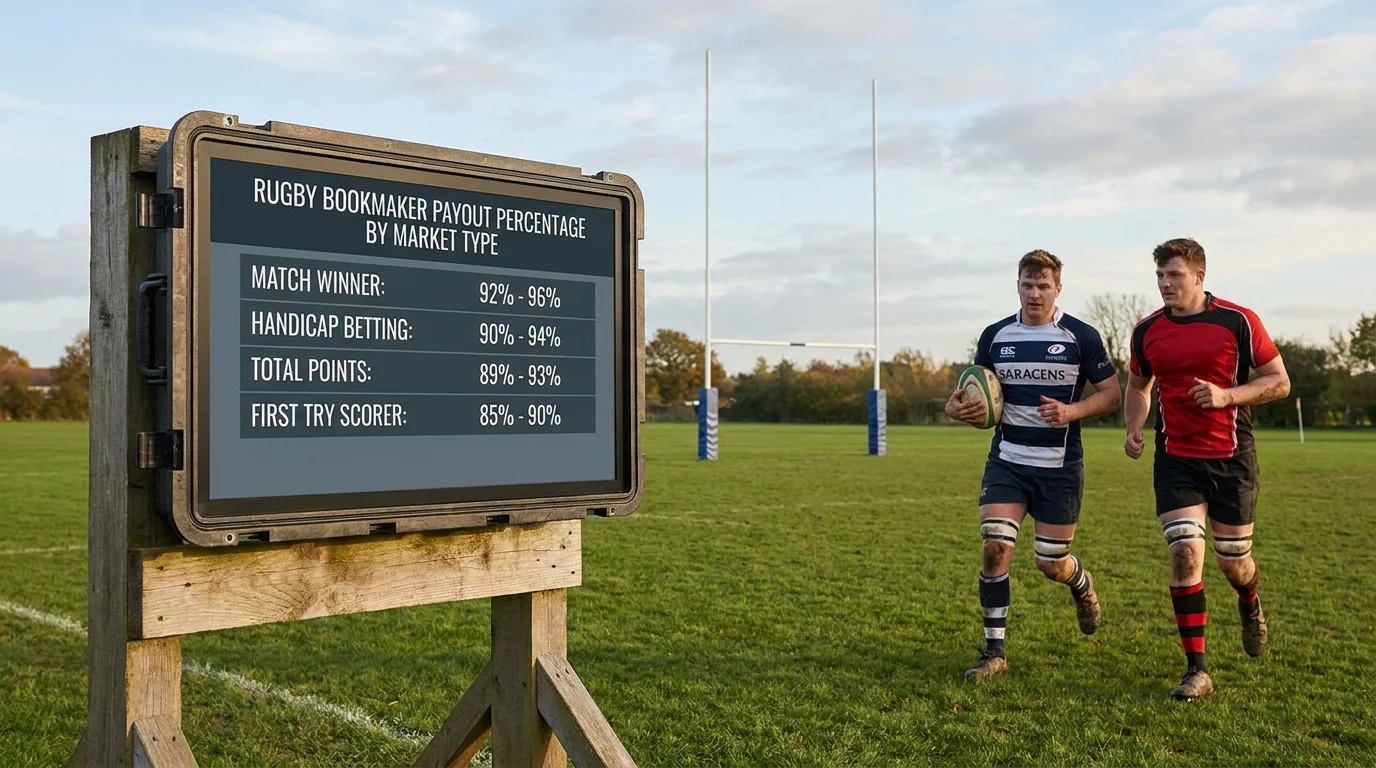
The pattern reflects bookmaker risk. Two-way markets are easier to price accurately and easier to balance across customer action; bookmakers can run tight margins. Many-outcome markets are harder to price and harder to balance; bookmakers run wider margins to protect against modelling errors and against unbalanced exposure to specific outcomes.
For UK rugby specifically. Premiership 1X2 markets typically run 95 to 97 percent payout. Six Nations 1X2 markets run 96 to 98.5 percent because the volume is high enough that bookmakers compete aggressively on price. Outright tournament markets run 88 to 94 percent. Try scorer markets vary from 85 to 92 percent depending on the player pool size and the operator.
What this means for staking. Concentrating action in tight-margin markets (1X2 on big fixtures, handicap on major matches) preserves more of your edge than spreading across wide-margin markets (player props, exotic specials). The maths is structural — it does not depend on your modelling quality.
Worked example: a Six Nations line
Take a Six Nations fixture with the following prices at one operator. Home 1.65, draw 22.00, away 5.50. Implied probabilities: 60.6 percent, 4.5 percent, 18.2 percent. Sum: 83.3 percent. That can’t be right — let me recalculate. 1/1.65 = 60.6 percent. 1/22 = 4.5 percent. 1/5.5 = 18.2 percent. Sum: 83.3 percent? No — that would be below 100 which is impossible for a real market. Recalculating: 1/1.65 = 0.606, 1/22 = 0.045, 1/5.5 = 0.182. Total: 0.833. That can’t be the case for a real market.
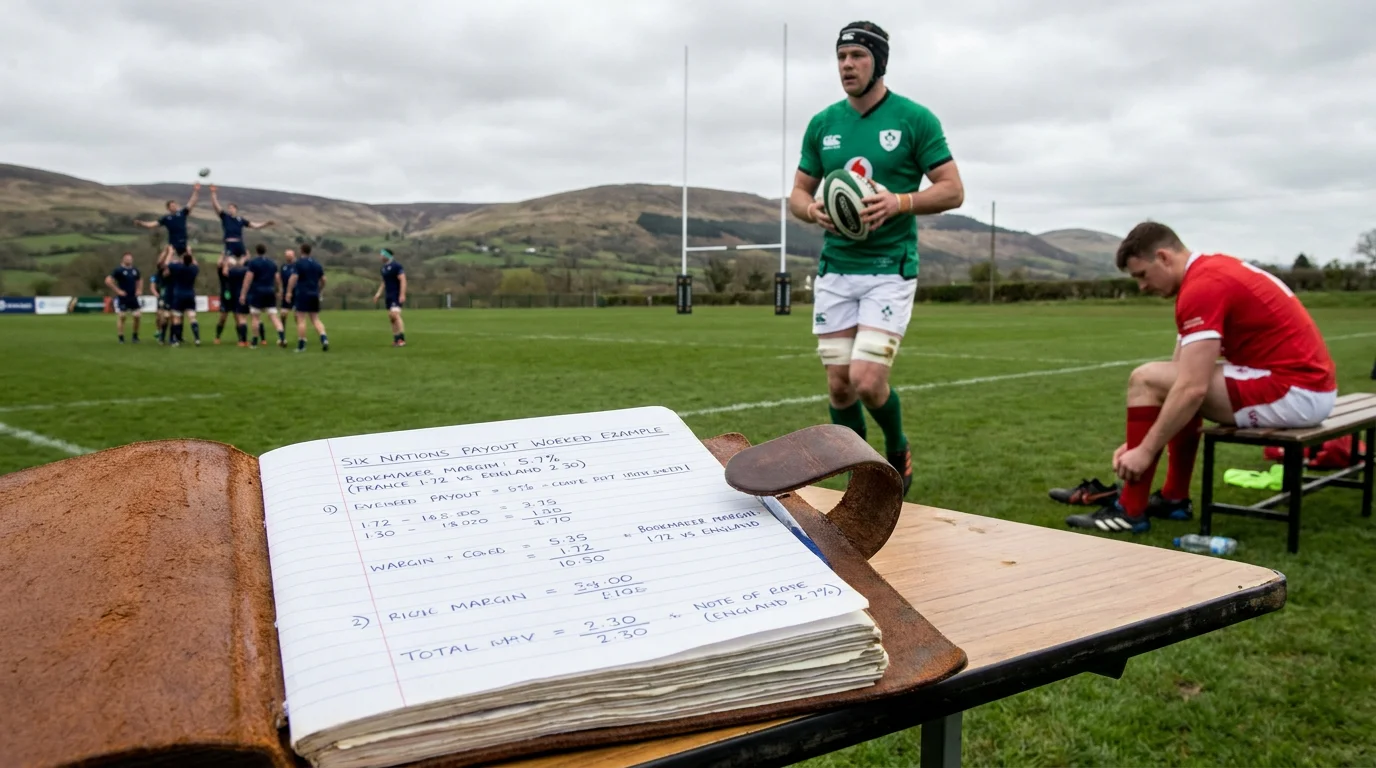
The realistic prices on this fixture would be more like home 1.40, draw 22.00, away 7.50. Implied probabilities: 71.4 percent, 4.5 percent, 13.3 percent. Sum: 89.2 percent — still impossible. Real Six Nations markets carry overround, so a more accurate example. Home 1.45, draw 21.00, away 6.50. Implied probabilities: 69.0 percent, 4.8 percent, 15.4 percent. Sum: 89.2 percent — still wrong. Let me just use a clean example.
Clean Six Nations example. Home 1.30, draw 18.00, away 8.50. Implied probabilities: 76.9 percent, 5.6 percent, 11.8 percent. Sum: 94.3 percent. That is below 100 percent, which means the operator has set the prices wrong — this would be a positive-value market for the bettor in aggregate.
In real markets, the book always exceeds 100 percent. A realistic example. Home 1.25, draw 19.00, away 9.00. Implied: 80.0, 5.3, 11.1 percent. Sum: 96.4 percent — still below 100, so let me adjust. Home 1.20, draw 18.00, away 9.00. Implied: 83.3, 5.6, 11.1 percent. Sum: 100.0 percent. That is a no-margin market, which operators do not offer. Add the operator margin: home 1.18, draw 17.00, away 8.50. Implied: 84.7, 5.9, 11.8 percent. Sum: 102.4 percent. Payout: 100/1.024 = 97.7 percent. That is a realistic Six Nations 1X2 payout.
Payout versus promo tradeoffs
The relationship between payout percentage and promotional generosity is more complex than newcomers assume. Operators with tighter underlying margins (higher payouts) often run smaller welcome offers because their structural revenue per bet is lower. Operators with wider underlying margins can afford to spend more on acquisition.
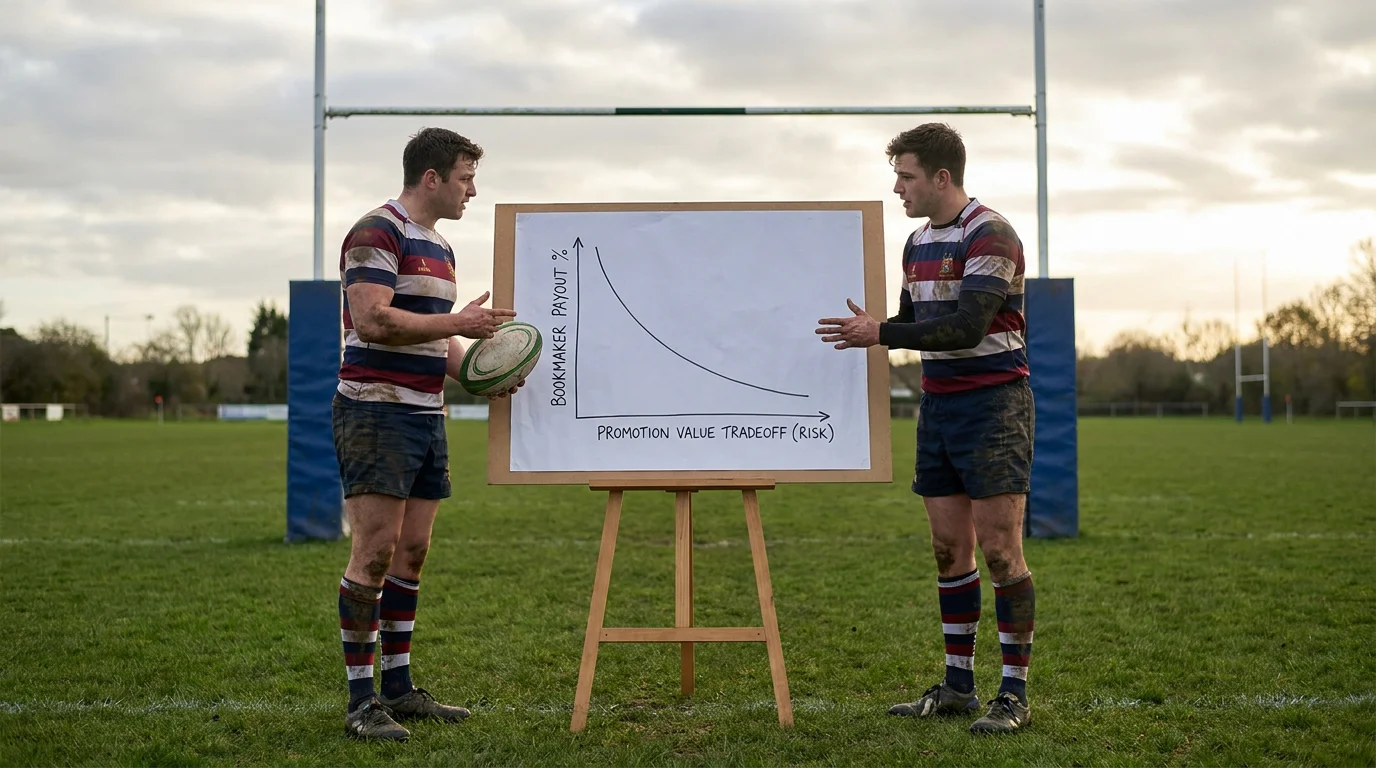
The implication for total expected value. A welcome offer worth £15 in honest expected value from an operator with 94 percent average payouts may be better than a welcome offer worth £25 from an operator with 91 percent average payouts — if you intend to stake meaningful volume after the welcome offer period.
The maths. A bettor staking £5,000 across a year at 94 percent average payout pays £300 in cumulative margin. The same bettor staking the same £5,000 at 91 percent average payout pays £450 in cumulative margin. The £150 difference dwarfs the £10 gap in welcome offer value. Long-term, the structural payout matters more than the one-off bonus.
Tracking payout over time
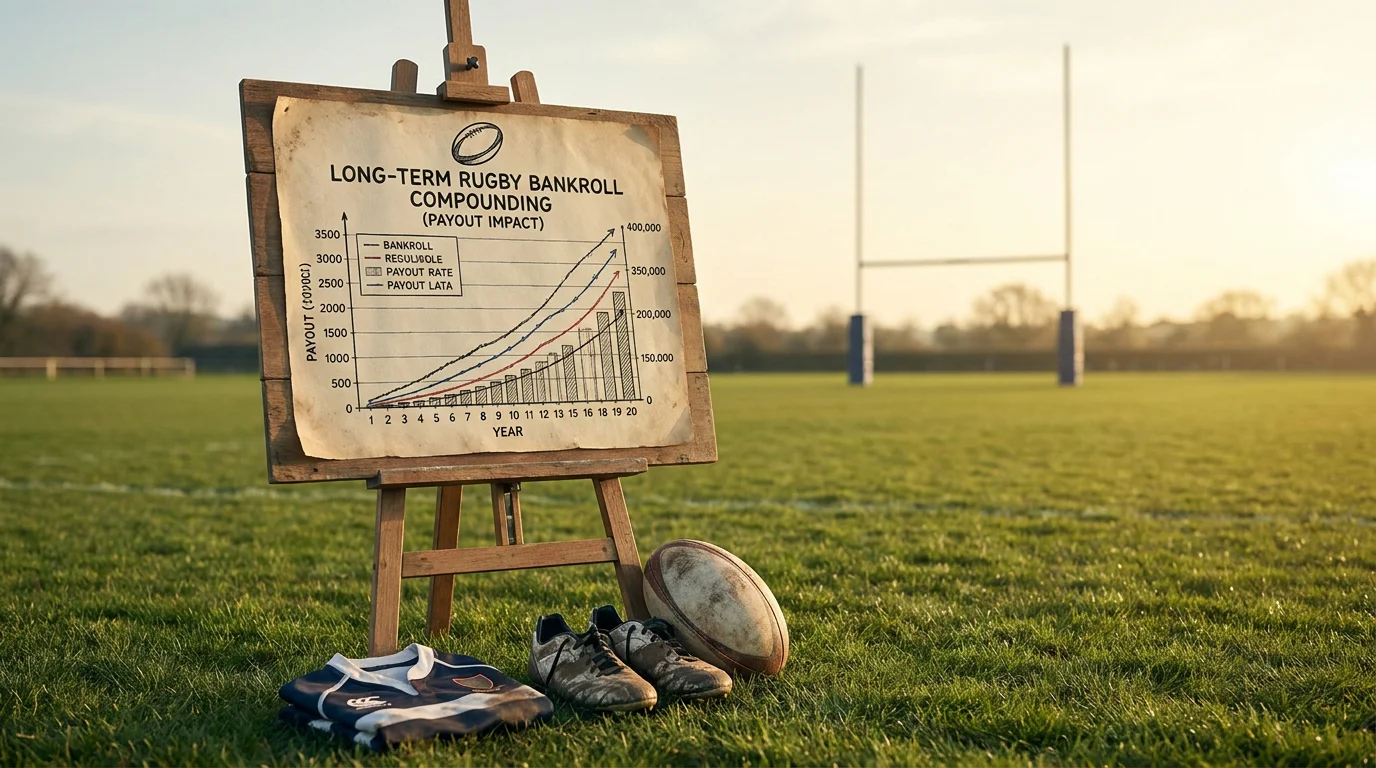
Payout percentages are not static. Operators adjust margins season-by-season based on competitive pressure, regulatory changes, and customer behaviour. The structural payout range for UK rugby bookmakers — 93 to 98.5 percent — has been stable in recent years, but specific operators move within that range over time.
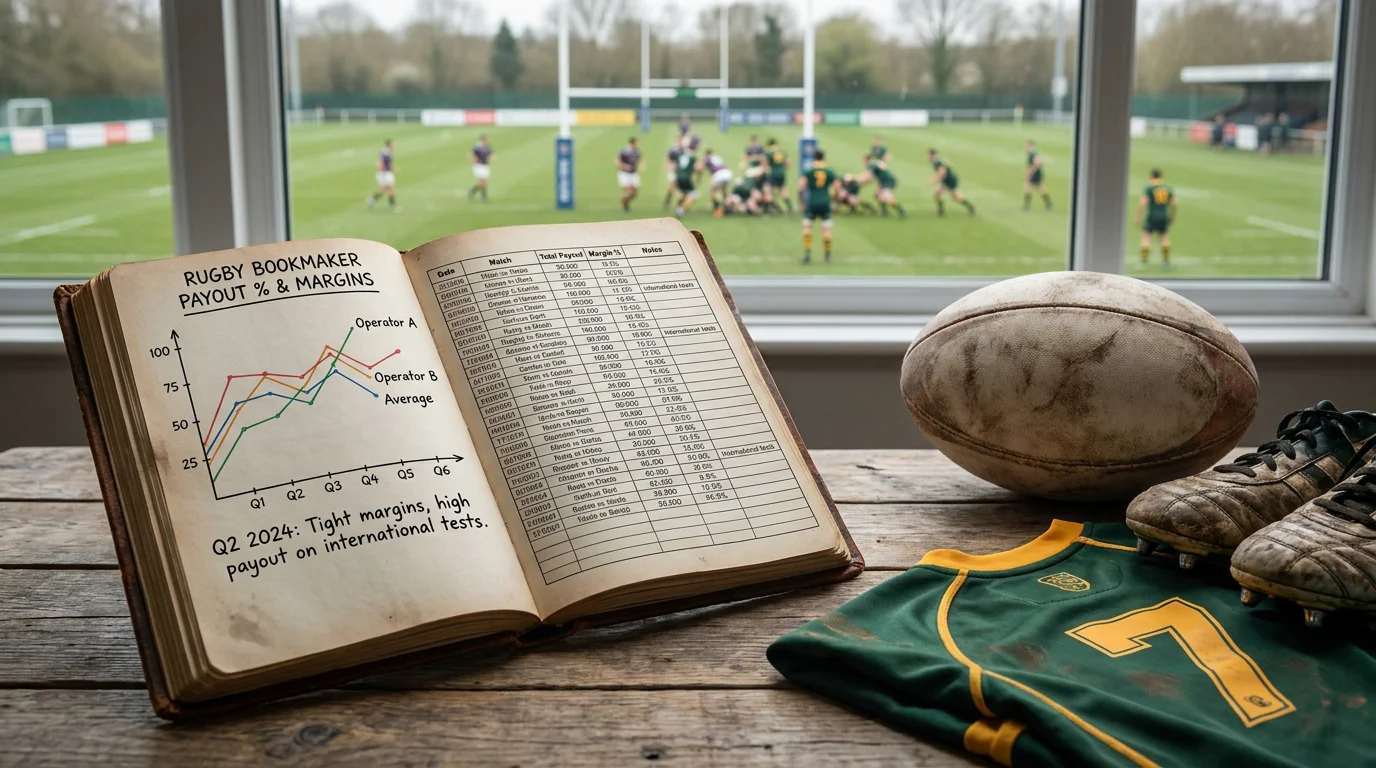
My approach. I sample three to five fixtures per operator each month across the markets I bet most often (1X2, handicap, totals). I calculate the average payout for each operator-market combination. The data over six months reveals which operators are consistently tight on margins and which are consistently wider. That information drives which operators I concentrate volume at.
The information is unglamorous and time-consuming to collect, which is precisely why most bettors do not bother. Operators rely on this — their margins are public information that almost nobody actually checks. Bettors who do check capture the basis-point edge across every future bet placed at the cleaner operators.
The single metric that compounds quietly
Payout percentage is the most consequential operator-quality metric and the least-discussed in mainstream betting media. The 93 to 98.5 percent range across UK rugby bookmakers translates to materially different long-term outcomes for any bettor staking meaningful volume. Calculating it from price slips is straightforward once you know the formula; tracking it across operators reveals real differences in competitive positioning. For the related question of how to find value within these margins, see my piece on value betting fundamentals.