
Rugby Try Scorer Betting: First, Anytime, and Last — Where the Value Lives
 Available in US
Why position bias is the foundation of try scorer pricing
The first time I sat down to model try scorer prices I made the mistake of treating every player on the pitch as a roughly equal candidate, weighted by recent form. That model lost money for two months. What I had ignored is the single biggest pattern in rugby union try-scoring: in the Six Nations 2023 sample, 66 percent of all tries were scored by three-quarters — backs — and 49 percent of all tries came in the first half of the match. Those two numbers are the foundation of how bookmakers actually build try scorer prices, and they should be the foundation of how you bet them.
The prop-richest markets in rugby live in this corner of the board. First try scorer, anytime, last, double try scorer, scorecast — all built off the same underlying probability, repriced for different timing windows. Knowing how the bookmaker stacks those windows is most of the work.
How bookmakers build try scorer prices
The model starts with two inputs. Expected tries for the team — derived from the handicap line and total points line — gets allocated to individual players based on their position, role, and recent finishing data. A starting winger in a side projected to score four tries gets the largest share of that expectation; a tighthead prop gets a tiny share, mostly from rolling-maul context.
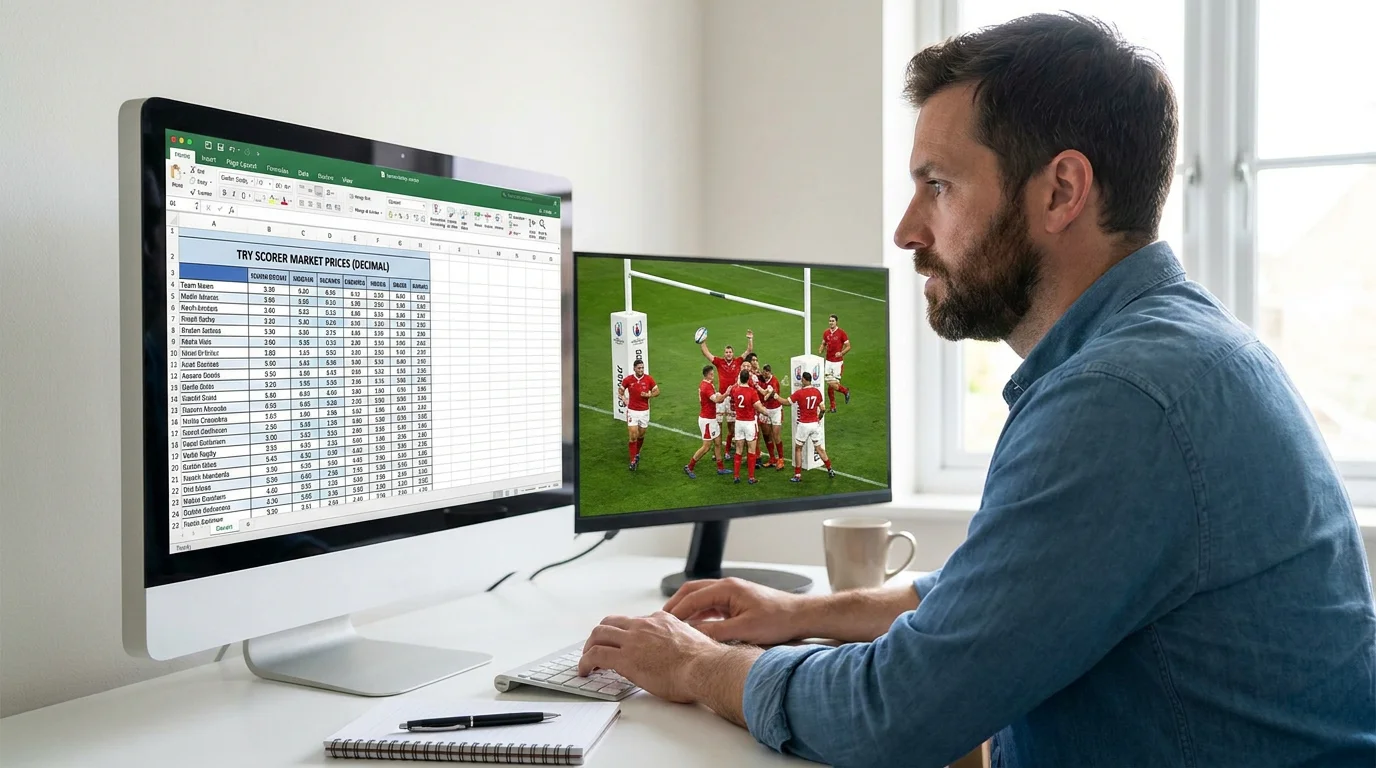
Then the bookmaker applies an overround. On anytime try scorer markets, the typical book percentage runs 130 to 140 percent across 20 to 25 named players plus “no try scorer” — the overround is wider than on 1X2 because individual probabilities are harder to model and the bookmaker hedges against variance.
That wider overround is the trade-off: more potential edge if you have a genuine read on a specific player, but a worse base rate if you are picking blindly from the named list. Line shopping matters here more than it does on 1X2. Two operators can have the same winger at 1.80 and 2.10 anytime, and over a season that gap is the difference between profit and loss.
Position bias: backs versus forwards
Back to the foundational stat. In Six Nations 2023, three-quarters scored 66 percent of tries. That number generalises reasonably well across top-tier union. Wingers and outside centres are the highest-volume scorers; full-backs come next; fly-halves and scrum-halves score occasionally on opportunistic plays. Forwards are concentrated around close-range mauls and pick-and-go phases.
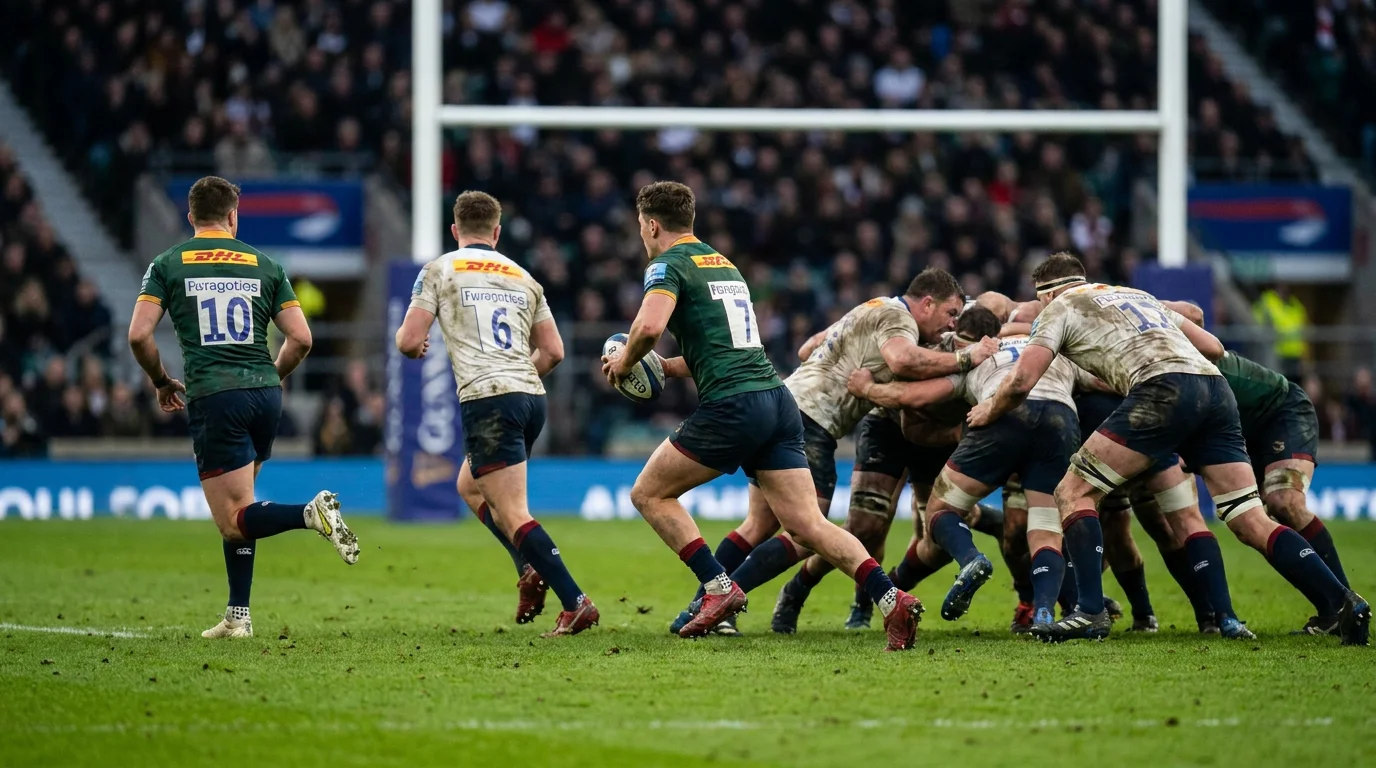
The market reflects this — but not always cleanly. Bookmakers tend to under-price forward try scorers in matches where the favourite is expected to dominate the gain-line. A back-row forward in a side that will spend 65 percent of the match in opposition territory has a genuine chance to score from short range, and the anytime price at 5.00 or 6.00 is often genuinely live.
The opposite pattern: a winger on a side that will spend most of the match defending has a much lower true probability than the price suggests. Bookmakers anchor on the player’s name and reputation; the actual match script is doing the pricing.
First, anytime, and last — a comparative view
Each timing window has its own logic. First try scorer rewards backs who get early ball: the wingers and outside centres in the favourite’s attacking shape. Half-backs are rarely the right pick for first try because their job is to create, not finish.

Anytime try scorer is the closest to a pure probability bet. It pays out if the named player scores at any point in the match. The prices on this market are the most stable across the 80 minutes — late substitutions affect them less, and the overround is widest, so line shopping pays off most.
Last try scorer is the weirdest of the three. The pricing reflects probability of scoring in the closing minutes, which means it rewards finishers — fresh wingers brought on from the bench, attacking centres who stay on the pitch for the full 80 — and penalises starters who get hooked at 60 minutes. Bookmakers sometimes price last try scorer too close to anytime, ignoring the substitution pattern. That mispricing is where I have found repeatable edges.
Finishers and bench impact
Bench impact is the hidden variable in last try scorer. Modern union teams treat the bench as a finishing unit — fresh forwards to drive the maul, fresh backs to exploit tired defensive lines. The last 15 minutes are when the bench earns its keep, and the players who come on around the 50-to-60-minute mark have a disproportionate share of late tries.
What I look at before staking on last try scorer: the announced bench in the team sheet, the historical try-scoring patterns of those specific bench players, and the projected score at 60 minutes. A blowout heading into the final 20 minutes means the bench team scores; a tight match means the starters stay on and last try sits with the regular line-up.
Anytime markets for bench players are often the cleanest value. A bench winger priced at 8.00 anytime might actually have a true probability closer to 6.00 if they enter at 55 minutes against a tired defence.
Combining try scorer with team handicap
Bet builder and scorecast markets let you combine team handicap with first try scorer for a single price. These can be excellent value or terrible value depending on whether the correlation is priced correctly.
The truth: first try scorer and team handicap are heavily correlated. If the favourite covers the handicap, the favourite is more likely to score the first try. Bet builders that combine “Team A covers 7.5” with “Player X first try scorer” should reflect that correlation in the price — and operators that use simple product-of-probabilities pricing offer better value than operators that explicitly model the dependency.
The honest test: if a 2.00 handicap pick and a 5.00 first try pick combine to roughly 10.00 in the bet builder, the price is using uncorrelated multiplication. The true odds, accounting for positive correlation, should be around 7.50 to 8.50. That means the 10.00 price is offering a genuine edge to the bettor — assuming you are willing to size the position accordingly.
Putting it together for a Saturday card
My typical workflow for a Six Nations or Premiership weekend. Identify two or three matches where the position bias is strongest — clear favourite, attacking shape that favours backs, big spread. Pick the anytime try scorer with the cleanest pricing across two or three operators. Avoid first try scorer unless I have a specific read on the opening 10-minute scenario, where my guide to predicting first try scorers covers the kick-off territory and set-piece logic in detail. Layer in last try scorer for bench players in matches projected to be tight at 60 minutes.

That structure has worked for me across multiple seasons in both union and league. The 66 percent backs share, the 49 percent first-half share, and the bench impact in the closing minutes are the patterns I trust because they reflect how the sport is actually played.
